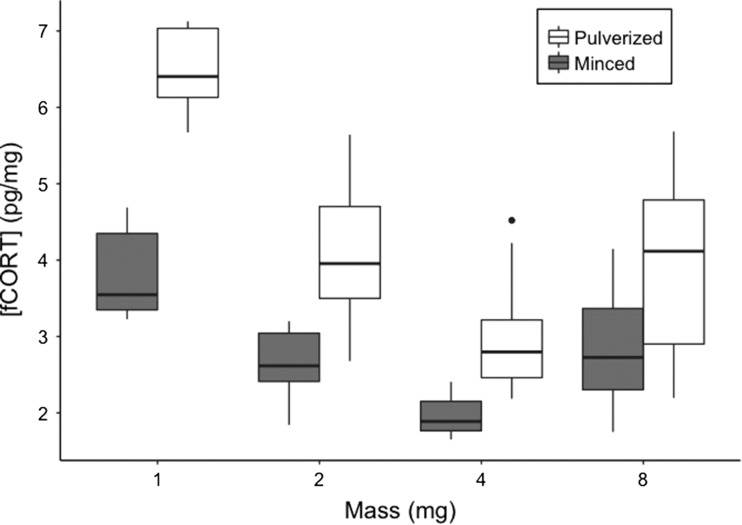
Figure 3:
Corticosterone concentrations (pg/mg) from pulverized (white) and minced (gray) turkey feather pools. Ten replicates were used for each combination of feather preparation and sample mass. Each box plot indicates the 25th, 50th (thickest line) and 75th percentiles while whiskers on each box represent the 10th and 90th percentiles.

