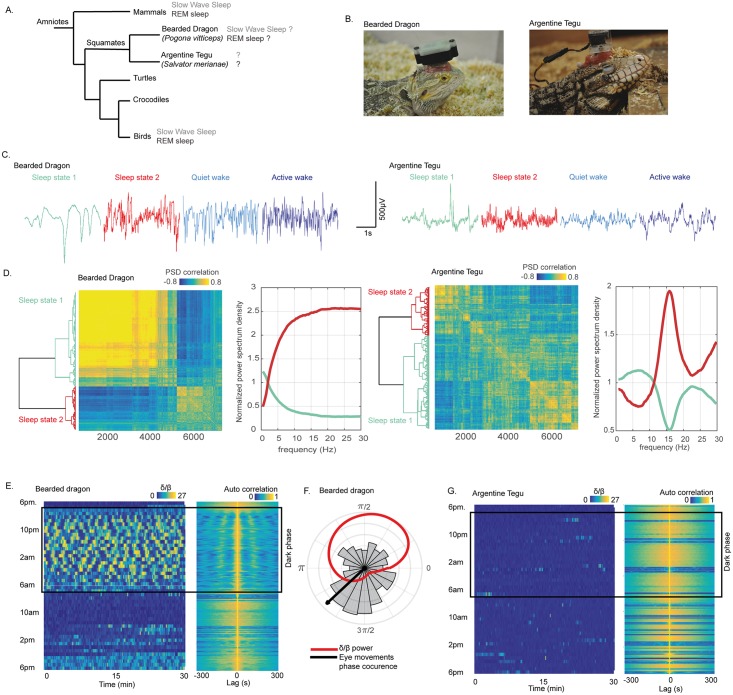
Fig 1. The tegu lizard does not sleep like a bearded dragon.
(A) Phylogenetic tree of amniotes representing the common origin of mammals, birds, and nonavian reptiles. The figure also illustrates that both REM sleep and SWS have been identified in mammals and birds and more recently possibly also in a lizard, the bearded dragon (P. vitticeps). We investigated sleep in the Argentine tegu (S. merianae) to determine whether the bearded dragon is the only lizard to display those two sleep states. (B) Pictures of the two species recorded. The animals were equipped with a recording device on their head. (C) Raw signal of one LFP recorded in the DVR with a 35-μm–diameter tungsten electrode in the two species during S1 (sharing similarities with mammalian SWS) in bluish, S2 (sharing similarities with mammalian REM sleep) in red, QW in light blue, and AW in dark blue. The raw data illustrate the difference in all states of the DVR LFP. (D) Dendrogram (left) and correlation map (right) obtained from the hierarchical clustering of the distance between the correlation of each LFP 3-s window PSD between 9 PM and 2 AM in both species. On the right of each correlation map are the normalized mean power spectra of the two clusters computed for one animal in each species representing the two distinct sleep states identified, S1 in bluish and S2 in red. The comparison of the normalized power spectra of each state reveals a frequency profile that is clearly different between the two species, with a desynchronized activity (composed of all the frequencies higher than 5 Hz) for the bearded dragon during S2 and a power spectrum mainly composed of 15-Hz oscillations for the tegu. (E) The band power ratio (δ [0.5–4 Hz]/β [11–30 Hz]) computed as in Shein-Idelson and colleagues [22] for the bearded dragon. Each horizontal segment represents 30 min of the ratio computed with a 10-s window and a step of 0.1 s. The value of the ratio is color coded from 0 (blue) to 27 (yellow). The figure from the top to the bottom represents the evolution of the ratio over 24 h from 6 PM. A dark rectangle indicates the dark period. On the right, the normalized autocorrelation map of the ratio is illustrated. The autocorrelation was computed within 600-s windows with a step of 1 s. Both figures reveal a rhythmic alternance with a period of around 90 s across episodes, with δ frequencies (yellow) and episodes with β (blue) during the dark period, when the animal is lying on the floor with the eyes closed. (F) The distribution of the eye movements within each δ–β cycle; the mean phase is represented with a black arrow. The red line is the mean δ/β power ratio across the δ–β cycle. (G) This is the same figure as (E) for the Argentine tegu. The figure reveals no clear cycle in the δ/β power ratio over 24 h. AW, active wake; DVR, dorsoventricular ridge; LFP, local field potential; PSD, power spectrum density; QW, quiet wake; REM, rapid eye movement; SWS, slow-wave sleep; S1, sleep state 1; S2, sleep state 2.

