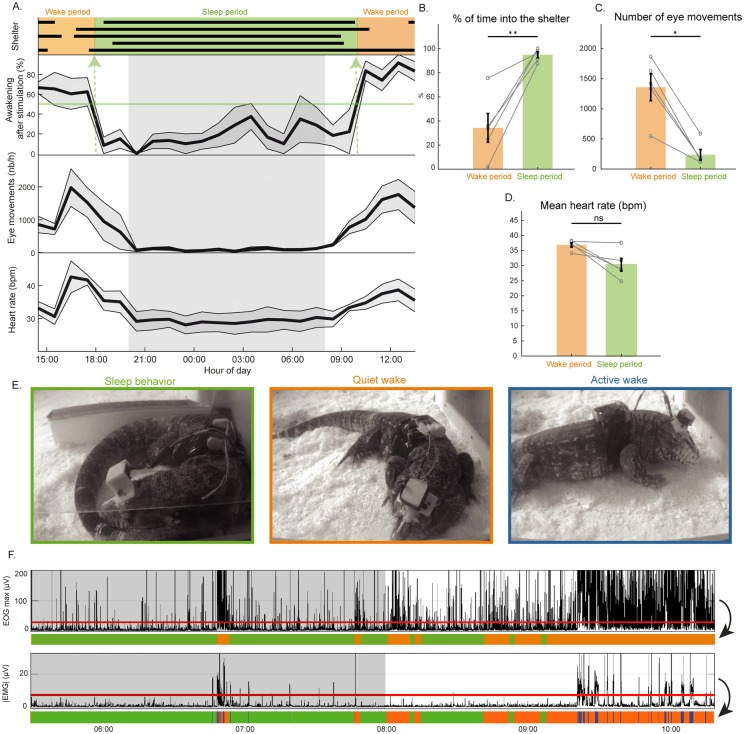
Fig 2. Behavioral sleep and automated scoring in the Argentine tegu (S. merianae).
(A) The gray zone between 8 PM and 8 AM represents the dark phase. Representation over 24 h of the time spent inside (black bars) the shelter for each of the five animals recorded (top); mean ± SEM (line and gray zone) percentage of awakenings induced by a sensory stimulation made every hour (n = 5 animals); the mean ± SEM number of eye movements per hour; the mean ± SEM heart rate per hour. Choosing a threshold of 50% of awakening induced by the stimulation, we defined wake (in orange) and sleep periods (in green). (B) The sleep period significantly matched with the time passed inside the shelter (p = 0.0079). (C, D) A significant decrease of the number of eye movements per hour (p = 0.0159) and tendency of heart rate decrease (p = 0.0556) occurred during sleep compared to wake. (E) Positions and behavior of an animal during the three behavioral states identified: SB (green panel), with an animal in its shelter, the body curled up and eyes closed; QW (orange panel) with and animal outside the shelter lying on the floor, eyes often closed; and AW (blue panel) with an animal moving. (F) Graph illustrating the eye movements (maximal value of the EOG for each 1-s window during 5 h). The red line indicates the threshold used to differentiate SB (green) from wake (orange). The graph below represents the average of the absolute value of the EMG for the same period. The red line indicates the threshold used to differentiate QW (orange) and AW (blue). AW, active wake; EMG, electromyogram; EOG, electro-oculogram; QW, quiet wake; SB, sleep behavior.

