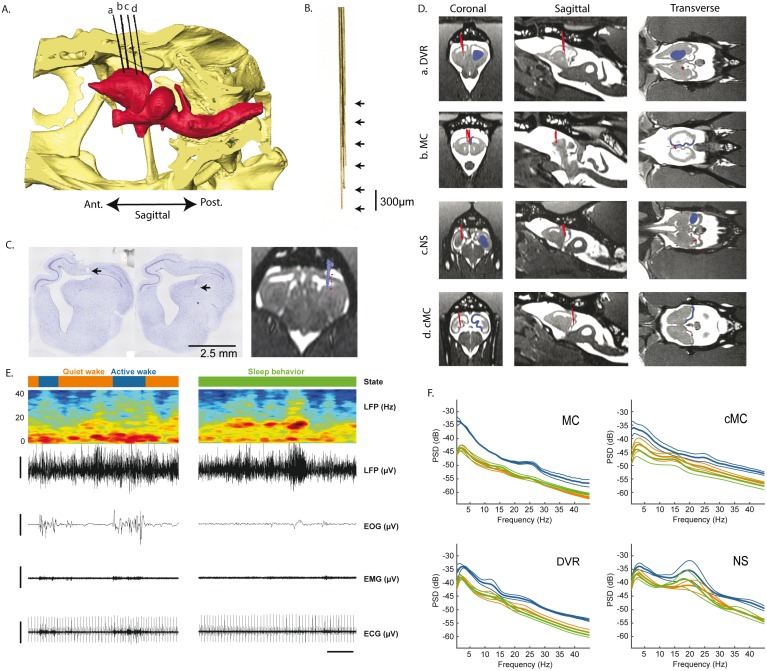
Fig 3. Electrode placement and raw signals.
(A) 3D sagittal reconstruction of a lizard skull (in yellow) and brain (in red) based on in vivo presurgical MRI and CT scans. Electrode bundles (in black) were reconstructed from postsurgery CT scans. The electrodes a–d are, respectively, in the DVR, rMC, NS, and cMC. (B) Pictures of one of the bundles composed of six tungsten wires of 35-μm diameter spaced by 300 μm vertically. (C) Left and middle: 7-μm brain slices, labeled with a Nissl stain. The black arrow illustrates the lesions made by the electrodes implanted in the DVR. Right: corresponding electrode bundle reconstruction merged with the MRI. (D) Coronal, sagittal, and transverse MRI sections of each region implanted (in blue). The positions of the bundles of electrodes reconstructed from a CT scan and merged with the presurgical MRI are shown in red. (E) Left top to bottom: hypnogram of a period showing AW (in blue) and QW (in orange) states; the time frequency spectrogram representation of a DVR LFP recording (in blue the low power, in red the high power); the DVR LFP raw trace; the EOG filtered with a low-pass filter at 10 Hz; the EMG filtered with a high-pass filter at 10 Hz; the ECG filtered with a high-pass filter at 10 Hz. The horizontal scale bar represents 10 s, and the vertical scale bars 200 μV. It shows that AW is characterized by the predominance of low frequencies in the LFP, the presence of eye movements, and an increase in muscle activity and heart rate. During QW and SB states, the spectral composition is quite similar. (F) Mean ± SEM, power spectra across animals, computed for each state (blue, AW; orange, QW; green, SB) and each region. AW, active wake; cMC, caudal medial cortex; CT, computed tomography; DVR, dorsoventricular ridge; ECG, electrocardiogram; EMG, electromyogram; EOG, electro-oculogram; LFP, local field potential; NS, nucleus sphericus; QW, quiet wake; rMC, rostral medial cortex; SB, sleep behavior.

