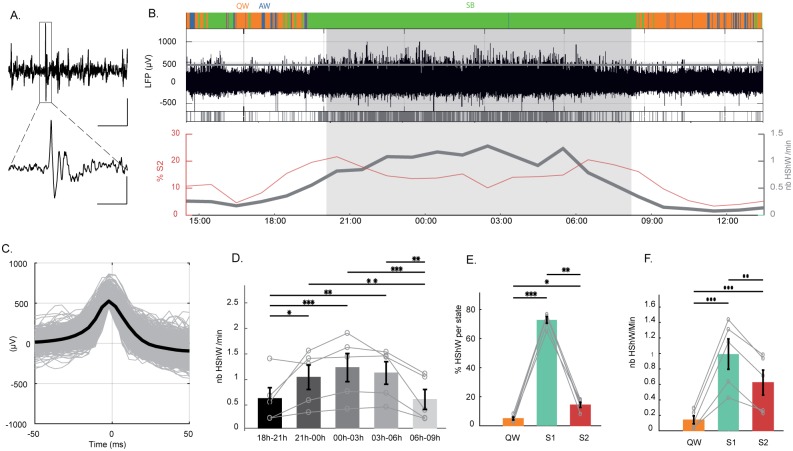
Fig 5. Sharp waves during sleep.
(A) LFP raw trace showing an HShW at low (horizontal scale bar represents 5 s) and high magnification (horizontal scale bar represents 0.5 s in the square area shown at the bottom); the vertical scale bar represents 400 μV. (B) From top to bottom: hypnogram during 24 h, raw traces of a DVR LFP. The gray line corresponds to the threshold used to detect the HShWs. Below, a raster plot of the HShWs detected is shown in gray. The number of HShWs per min (in gray) and the percentage of S2 (in red) are shown. They appear to occur in antiphase. (C) All and mean waveforms of the HShWs detected by the automatic detection. (D) Histograms showing that HShWs occur more in the middle than at the beginning and at the end of the night (n = 5). From top to bottom: p = 0.0026, p = 0.0006, p = 0.0087, p = 0.0034, p = 0.0007, and p = 0.0112. The gray lines represent individual values. (E) Histograms showing that HShWs occur mainly during S1 (n = 5, QW [in orange] versus S1 [in bluish], p = 0.0002; QW versus S2 [in red], p = 0.0139; S1 versus S2, p = 0.0088). (F) Density of HShWs is also higher during S1 (n = 5; QW versus S1, p < 0.0001; QW versus S2, p = 0.0008; S1 versus S2, p = 0.0047). AW, active wake; DVR, dorsoventricular ridge; HShW, high-amplitude sharp wave; LFP, local field potential; QW, quiet wake; SB, sleep behavior; S1, sleep state 1; S2, sleep state 2.

