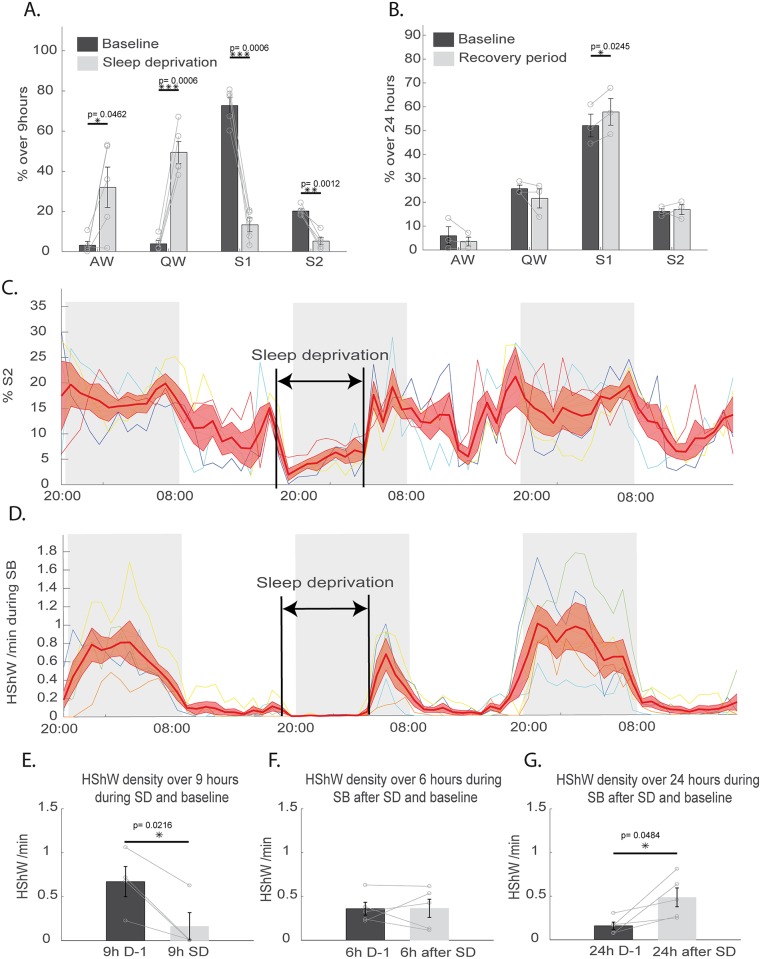
Fig 6. Effect of sleep deprivation on tegu sleep.
(A) Quantification over 9 h of baseline (dark gray) and 9 h of sleep deprivation (light gray) of the percentage occupied by all states, including AW, QW, S1, and S2, showing the efficiency of SD. S1 was scored automatically based on the decrease of the eye movement density associated with a low muscle tone, and S2 was scored based on the 15-Hz oscillations. (B) Quantification over 24 h of baseline (dark gray) and the 24 h following the sleep deprivation (light gray) of the percentage occupied by all states, showing the recovery of S1. (C) Representation of the individual (thin colored lines) and mean ± SEM (large red line) percentage of S2 per hour, from the day before SD to the day after. The thin colored lines are the individual changes in such percentage. (D) Representation of the individual (thin colored lines) and means ± SEM (large red line) of the HShW density per hour, from the day before SD to the day after. (E) Histograms showing a significant reduction in the number of HShWs during sleep deprivation (n = 4, p = 0.0216). (F) No effect on the HShW density during the 6 h of SB following SD was detected, but a significant (G) increase was observed over 24 h after SD. AW, active wake; HShW, high-amplitude sharp wave; QW, quiet wake; SB, sleep behavior; SD, sleep deprivation; S1, sleep state 1; S2, sleep state 2.

