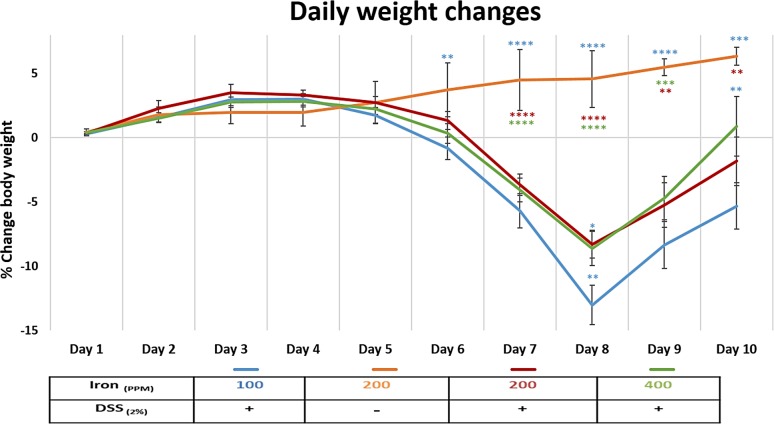
Fig 1. Daily weight changes.
Percentage weight change in mice consuming diets containing iron [100 ppm (blue), 200 ppm (red) and 400 ppm (green)] during dextran sulfate sodium (DSS)-induced colitis, and mice consuming a diet containing 200 ppm iron without DSS treatment (orange) during the 10-day study period. Data are presented as a mean ± standard error of the mean (SEM). Statistical differences were assessed by Kruskal–Wallis test followed by multiple comparisons (Conover-Inman) tests (* p<0.05, ** p<0.01, *** p<0.001, **** p<0.0001). (n = 30 female mice per DSS-treated; n = 22 mice per untreated group).

