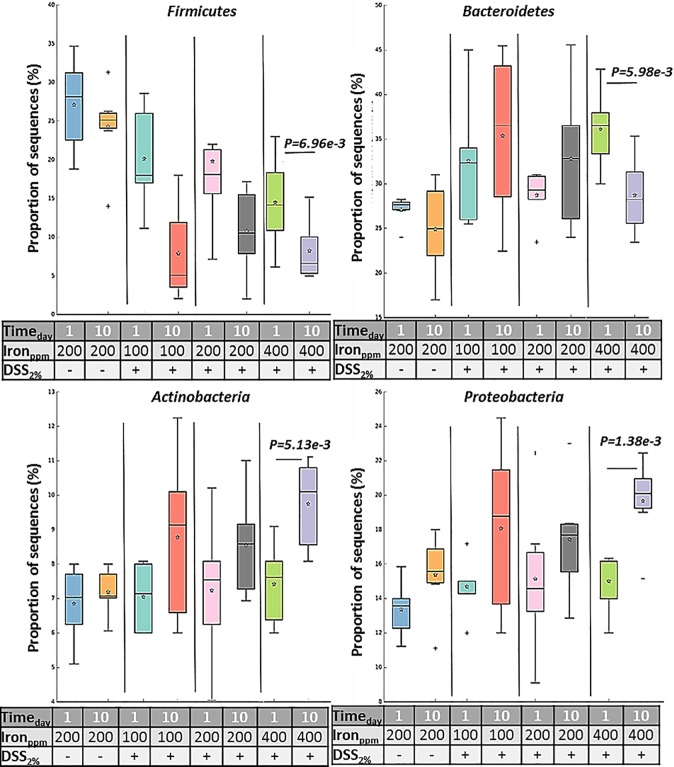
Fig 7. Proportions of sequences.
Box plot is showing the distribution in the proportion of four key phyla (Firmicutes, Bacteroidetes, Actinobacteria and Proteobacteria) assigned to samples from all groups at day-1 and day-10. Boxes indicate the interquartile ranges (75th to 25th IQR) of the data. The median values are shown as lines within the box, and the mean values are indicated by stars. Whiskers extend to the most extreme value within 1.5*IQR. Outliers are shown as crosses. Statistical differences were assessed by Welch’s t-test followed by Storey’s FDR multiple test correction.

