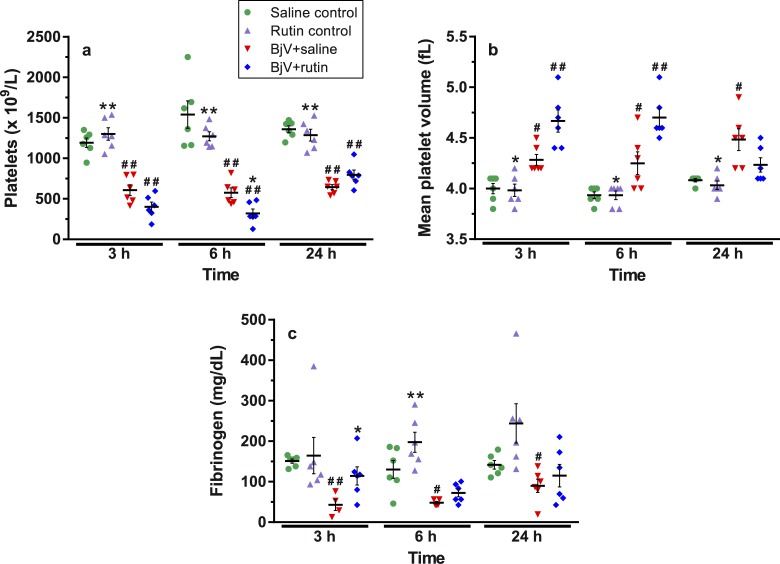
Fig 5.
Platelets counts (a), mean platelet volume (b), plasma fibrinogen levels (c) at 3, 6 and 24 h after treatments. Two-way ANOVA were used, followed by Bonferroni post-hoc test; # p< 0.05 and # # p< 0.001 when compared to saline control group on the respective time; * p< 0.05 and ** p< 0.001 when compared to BjV+saline group on the respective time. Data were expressed as mean ± S.E.M. (n = 4-6/group).

