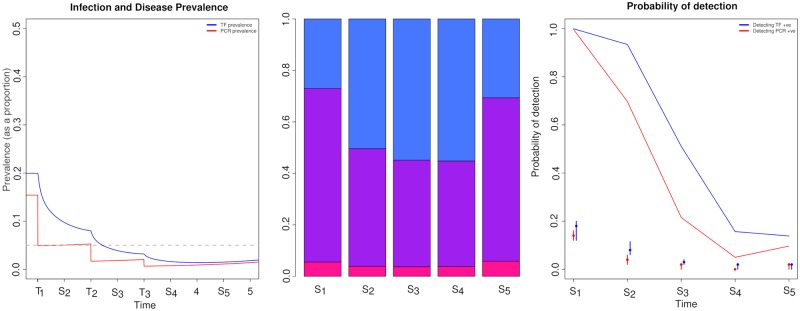
Fig 2. Changes in the prevalence and detectability of PCR (red) and TF (blue) positive individuals over an intervention period.
a) prevalence of infection and disease prevalence change during an intervention within the community, points on the x axis labelled with an S indicate that a sample was taken at that point, and those labelled with a T indicate when treatment occurred. b) the proportion of individuals present in each diagnostic state at each sampling point during the intervention period: pink—PCR positive only, purple—PCR and TF positive, blue—TF positive only and c) indicates the probability of detecting at least 1 positive individual when taking 50 samples by PCR (red) and TF (blue) eye examination, dots represent the median prevalence point from 100 binomial samples for PCR and TF at each sampling point, the intervals represent the lower and upper inter-quartile range of prevalence.

