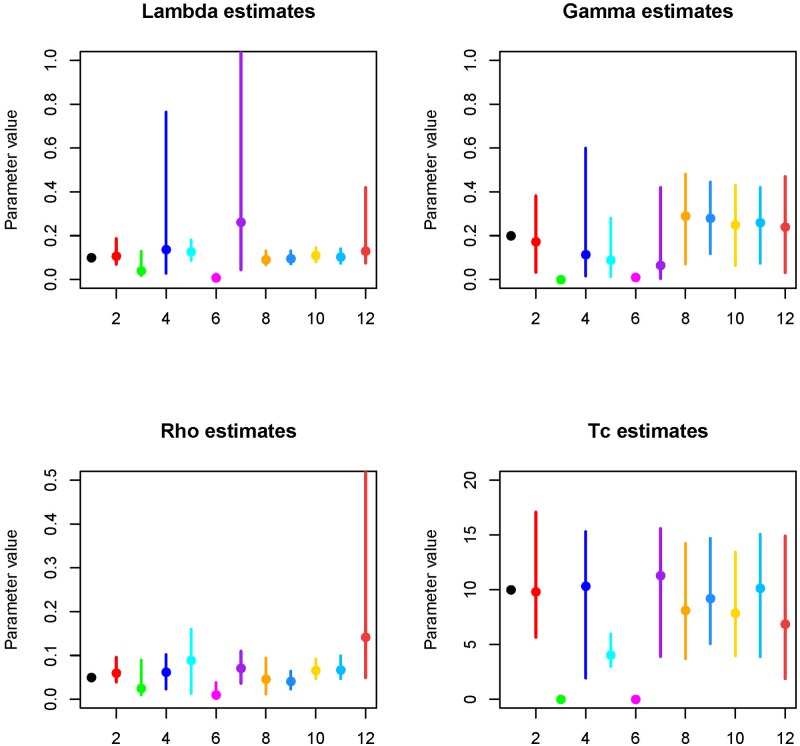
Fig 6. The estimated value for each sero-catalytic model parameter using different simulated datasets.
For each parameter the true value is indicated in black (x label 1), fitting to all-age data for both cross-sections simultaneously is highlighted in red. All-age pre-intervention only data (green, 2 parameters estimated), all-age post intervention data only (blue), 1-9 year old data—2 cross-sections (cyan), 1-9 year old data pre-intervention data (pink), 1-9 year old data post-intervention (purple), 1-9 and 10-20 year olds pre and post-intervention (orange), 1-9 and 20-30 year olds pre and post-intervention (light blue), 1-9 and 30-40 year olds pre and post-intervention (yellow), 1-9 and 40-50 year olds pre and post-intervention (sky blue), 1-9 and 50-60 year olds pre and post-intervention (rust).

