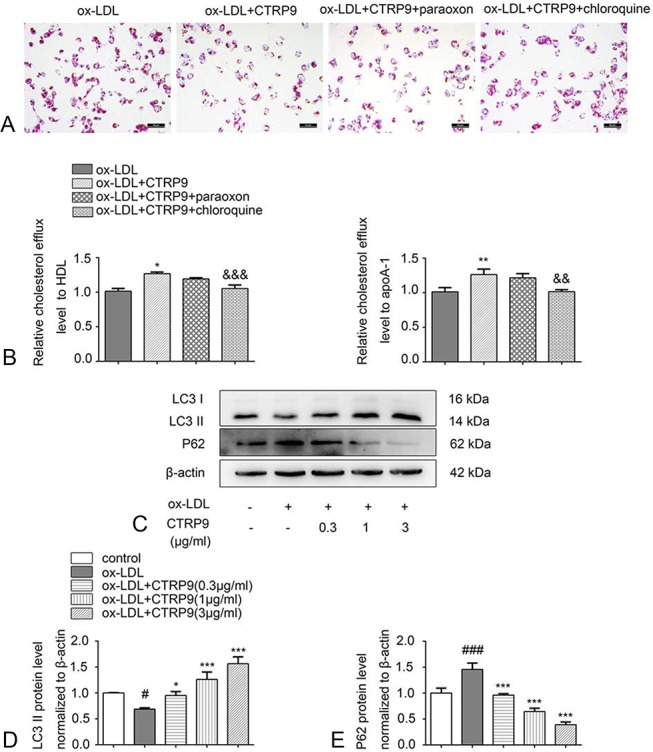
FIGURE 3.

CTRP9 promotes cholesterol efflux through the acid lipolysis pathway and induces autophagy. A, Foam cells accepted the culture of 3 μg/mL of CTRP9 and paraoxon (10 μM) or chloroquine (20 μM), and Oil Red O staining and Harris hematoxylin staining were performed. B, After the cell treatments described above, the relative cholesterol efflux level was detected with HDL or apoA-1. C–E, Macrophages were cultured using CTRP9 with different concentrations with or without ox-LDL. Western blot was used to assess the protein expression levels of LC3 II and p62. Values are shown in the form of the mean ± SD of 3 experiments conducted independently. *P < 0.05, **P < 0.01 and ***P < 0.001 versus the ox-LDL group. &&P < 0.01 and &&&P < 0.001 versus the ox-LDL + CTRP9 group. #P < 0.05 and ###P < 0.001 versus the control group.
