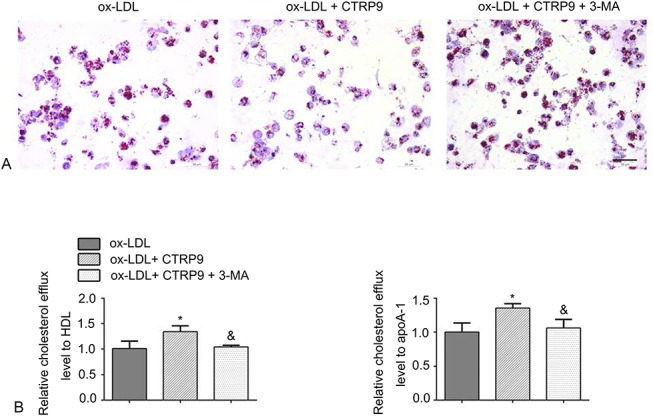
FIGURE 4.

Autophagy blockage reverses the effect of CTRP9 on foam cells. A, Foam cells were incubated with or without 3-MA (10 mM) 30 minutes before the addition of CTRP9. Staining processes using Oil Red O and Harris hematoxylin were performed, respectively, to examine foam cell formation. B, After the cell treatments described above, the relative cholesterol efflux level was detected with apoA-1 or HDL. *P < 0.05 versus the ox-LDL group. &P < 0.05 versus the ox-LDL + CTRP9 group.
