
FIGURE 5.
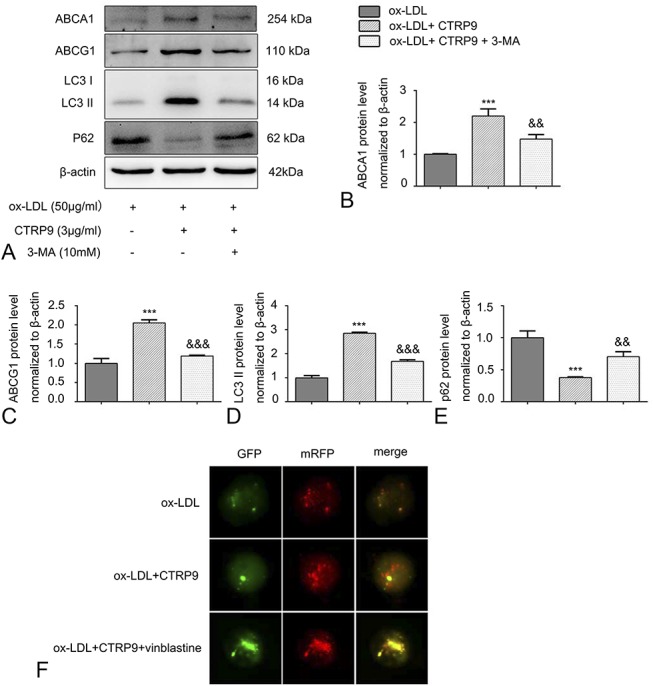
Autophagy inhibitors reverse the protein expression and autophagy flux changes induced by CTRP9 in foam cells. Cells were treated as mentioned above. A–E, Cholesterol reverse transporter (ABCA1 and ABCG1) and autophagy-associated protein levels (LC3 II and p62) were assessed in virtue of the Western blot. Values are presented in the form of the mean ± SD of 3 experiments conducted separately. F, GFP-RFP-LC3 was transiently transfected into cells as described before. Foam cells were incubated with or without vinblastine (20 μM) before the addition of CTRP9. Immunofluorescence images of yellow and red fluorescent puncta were acquired using a fluorescence microscope (magnification ×400). Values are presented as the mean ± SD of 3 separate experiments. ***P < 0.001 versus the ox-LDL group. &&P < 0.01 and &&&P < 0.001 versus the ox-LDL + CTRP9 group.