
Figure 1.
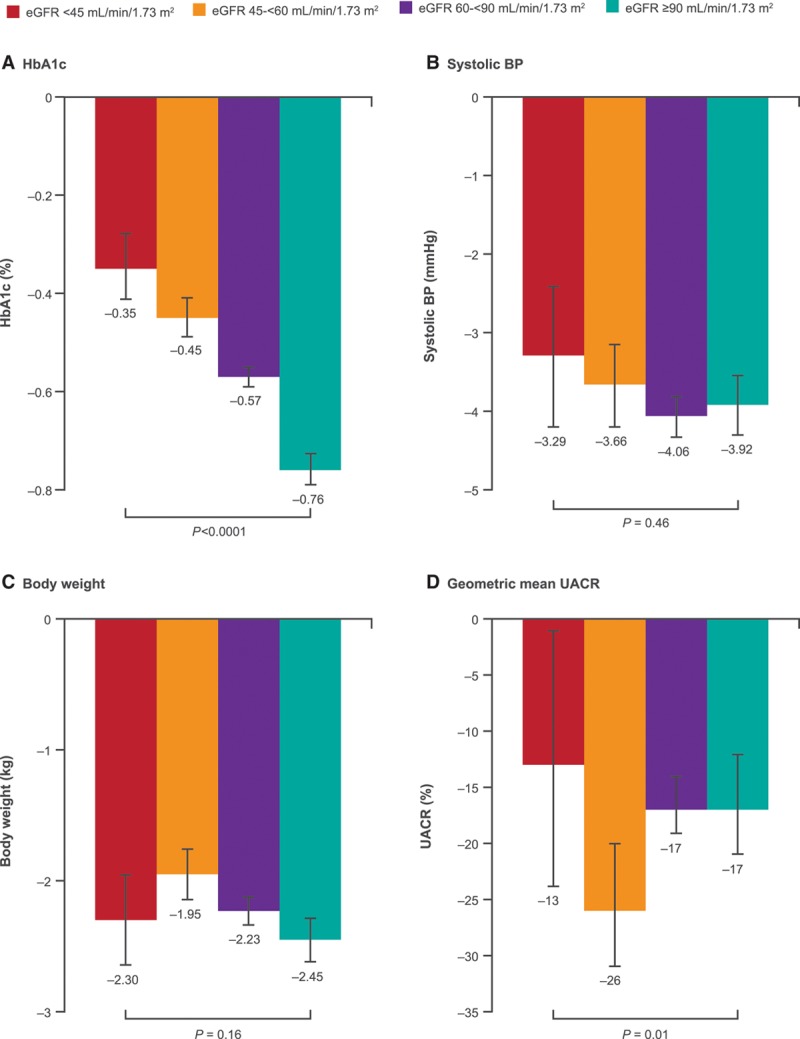
Changes in intermediate outcomes with canagliflozin compared to placebo in participants with eGFR <45, 45 to <60, 60 to <90, and ≥90 mL/min/1.73 m2 at baseline. Represents the mean difference in change from baseline between canagliflozin and placebo from post-baseline to end of follow-up, except for UACR, where it is percent change in the geometric mean of canagliflozin relative to placebo. BP indicates blood pressure; eGFR, estimated glomerular filtration rate; HbA1c, glycohemoglobin; and UACR, urinary albumin/creatinine ratio.