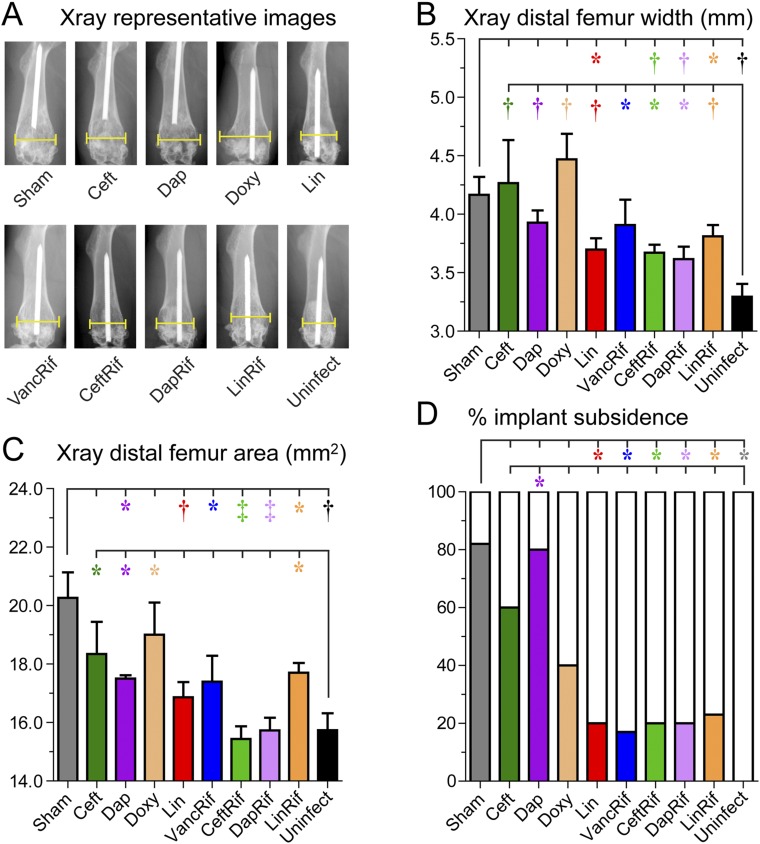
Fig. 3.
Effect of antibiotic therapy on bone changes and implant subsidence seen on radiographs made after 6 weeks of antibiotic or sham treatment (n = 5 to 10/group). Fig. 3-A Representative anteroposterior radiographs with brackets denoting maximal femoral width. Fig. 3-B Mean maximum width of the distal 25% of the femur in millimeters (and SEM). Fig. 3-C Mean area of the distal 25% of the femur in square millimeters (and SEM). Fig. 3-D Percentage of femora with proximal displacement of the implant (subsidence) out of the total number of femora in each group (and SEM). *p < 0.05, †p < 0.01, and ‡p < 0.001 for the difference between the antibiotic and sham treatment or uninfected control mice as shown by the Mann-Whitney 1-tailed test (Figs. 3-B and 3-C) or the Fisher exact 1-tailed test (Fig. 3-D).

