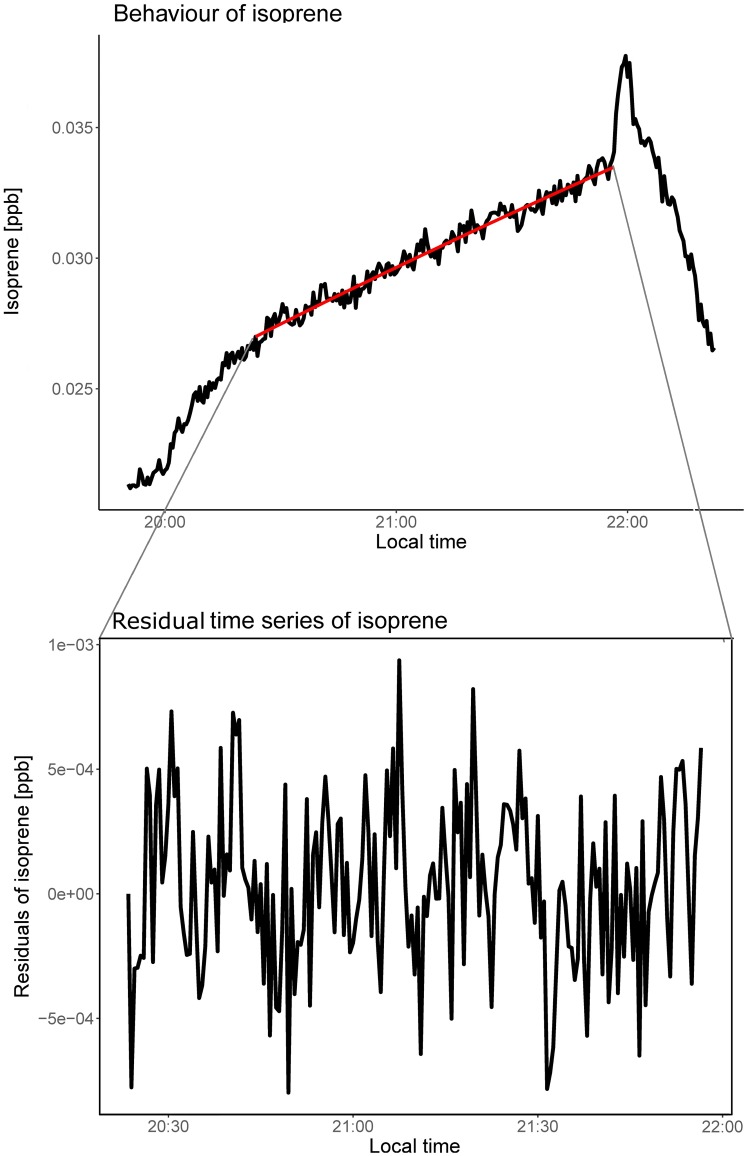
Fig 1. Time series of isoprene.
The upperpanel shows the mixing ratio of isoprene (in ppb) during the film "I’m off then". This time series was already divided by the number of viewers. The black line shows the measured values and the red one the modelled mixing ratio assuming a constant emission rate of isoprene. The lower panel shows the residuals obtained by subtracting the measured times series from the modelled one.

