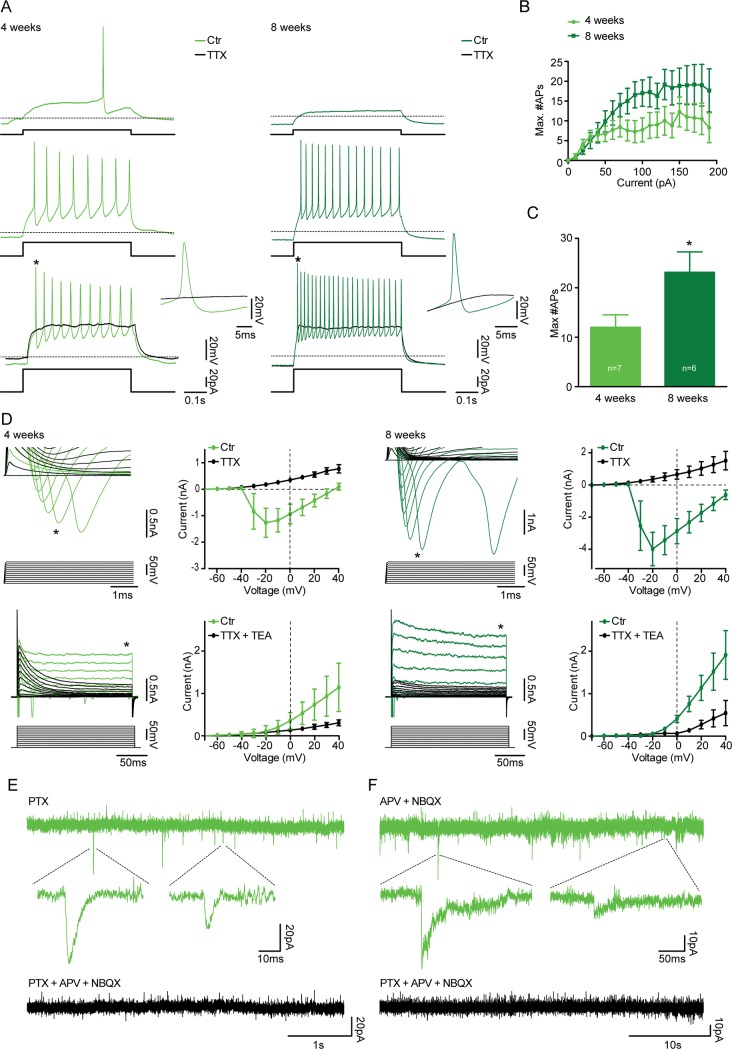
Fig 5. Three TF combinations induce hES-iNs which form functional synapses.
Whole-cell patch-clamp recordings were performed from NF-derived hES-iNs at 4 (n = 7) and 8 (n = 6) weeks after induction. For hES-iNs generated with N and NS, see S2 and S3 Figs. (A) Representative voltage traces illustrating the NF-derived hES-iNs’ ability to generate APs during a current step from a holding potential of -70mV at 4 (light green) and 8 (dark green) weeks after induction. APs were completely abolished in the presence of 1μM TTX (black traces). * indicates expanded APs. (B) Diagram illustrate the number of APs generated plotted against the current steps. (C) Bar diagram illustrate the maximal number of APs generated during current steps (10–190 pA in 10 pA steps). * indicates significant difference (p < 0.05). (D) Expanded current traces illustrate the inward sodium current (top, denoted by *) and the outward sustained potassium current (bottom, denoted by *) activated during voltage steps ranging from -70 mV to +40 mV in 10 mV steps at 4 (light green) and 8 (dark green) weeks after induction. The sodium and the potassium current were blocked by the presence of 1 μM TTX (top, black) and 1μM TTX + 10 mM TEA (bottom, black), respectively. The plots illustrate the sodium current peak (top) and the outward potassium current (bottom) plotted against the voltage steps in the absence and presence of TTX and TTX+TEA, respectively. (E) Current trace illustrates the presence of glutamatergic sPSCs at 4 weeks after induction, recorded in the presence of 100 μM PTX and blocked by addition of 5 μM NBQX and 50 μM APV. (F) Current trace illustrates the presence of GABAergic sPSCs at 4 weeks after induction, recorded in the presence of 5 μM NBQX and 50 μM APV and blocked by addition of 100 μM PTX.

