Figure 4.

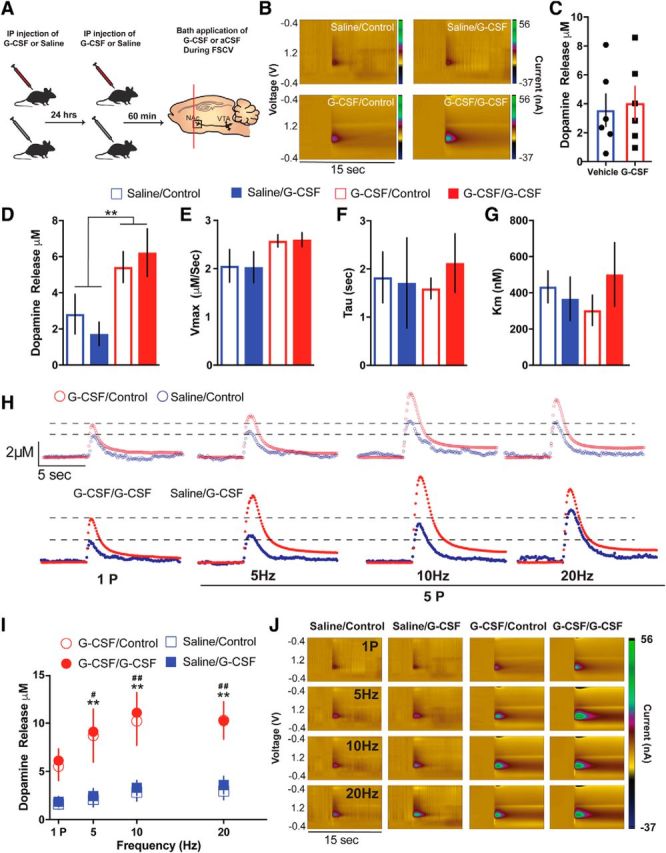
G-CSF effects on dopamine release are not through direct actions on dopamine terminals. A, Timeline of G-CSF injections. Animals were injected with either saline or G-CSF 24 h and then 60 min before ex vivo voltammetry (left; n = 3–6 per group). B, Color plots showing the presence of dopamine after a one-pulse stimulation (n = 3–6 per group). C, There were no effects of G-CSF bath application on dopamine release. D, Group data showing dopamine release following G-CSF or saline pretreatment and G-CSF or aCSF bath application. G-CSF pretreated groups showed elevated levels of NAc dopamine release. G-CSF bath application did not have a significant effect. **p < 0.01 from saline treated. E, G-CSF pretreatment or bath application did not alter maximal rates of dopamine uptake (Vmax), (F) dopamine clearance (tau), or (G) the ability of dopamine to bind to the dopamine transporter (Km). H, Current versus time plots showing increased dopamine release to increasing stimulation frequency. I, Dopamine release in response to multiple pulse stimulation parameters was increased in the G-CSF pretreated animals but not following G-CSF bath application. **p < 0.01 G-CSF/G-CSF versus Saline/Control, # p < 0.05 G-CSF/Control versus Saline/Control, ## p < 0.01 G-CSF/Control versus Saline/Control. J, Color plots showing the presence of dopamine following G-CSF pretreatment and bath application. All data are presented as mean SEM.
