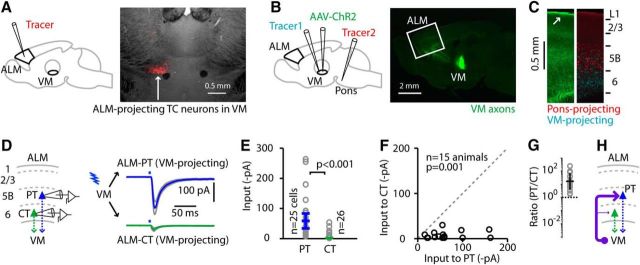
Figure 1.
Excitatory input from VM TC axons to VM-projecting ALM neurons is much stronger to layer 5B PT neurons than to layer 6 CT neurons. A, Fluorescence image (right) showing ALM-projecting TC neurons in VM following injection of retrograde tracer into ALM (left). B, Left, Strategy for retrogradely labeling ALM PT and CT neurons from the pons and thalamus, and for anterogradely labeling thalamocortical projections from VM. Right, Fluorescence image showing projections of TC axons from VM following the injection of AAV-ChR2-Venus into VM in a wild-type animal. White box: anterior cortex, including ALM. C, Cortical labeling pattern in ALM slices following the injections depicted in B, with VM axons (left, green) at particularly high density in layer 1 (arrow); demarcation of layer 5B by retrograde labeling of pons-projecting PT neurons (right, red); and labeling (cyan) of both VM-projecting PT neurons (in layer 5B) and CT neurons (in layer 6). D, Monosynaptic EPSCs recorded in VM-projecting PT (blue) and CT (green) neurons in ALM, evoked by a brief photostimulus (blue bars above traces) to activate ChR2-expressing VM axons, in the presence of TTX and 4AP (see Materials and Methods). Traces represent group-averaged responses (±SEM; gray lines). E, Cell-based group comparison. Input to PT and CT neurons (circles). Error bars represent the median input across cells (±m.a.d.). Results for WT and Calb1-Cre mice were similar and therefore pooled for analysis. The p value for the rank-sum test comparing the two groups is shown, along with the numbers of cells per group. F, Animal-based group comparison. Pairwise comparison of input to the same groups of PT and CT neurons, averaged by animal (each datum represents one animal). The p value for the sign test comparing the two groups is shown, along with the number of animals. G, Animal-based ratios. The ratio of input to PT divided by input to CT is shown for each animal (circles), along with the geometric mean and the geometric standard factor (bars). H, Schematic depiction of the cellular connectivity pattern.

