
Figure 4.
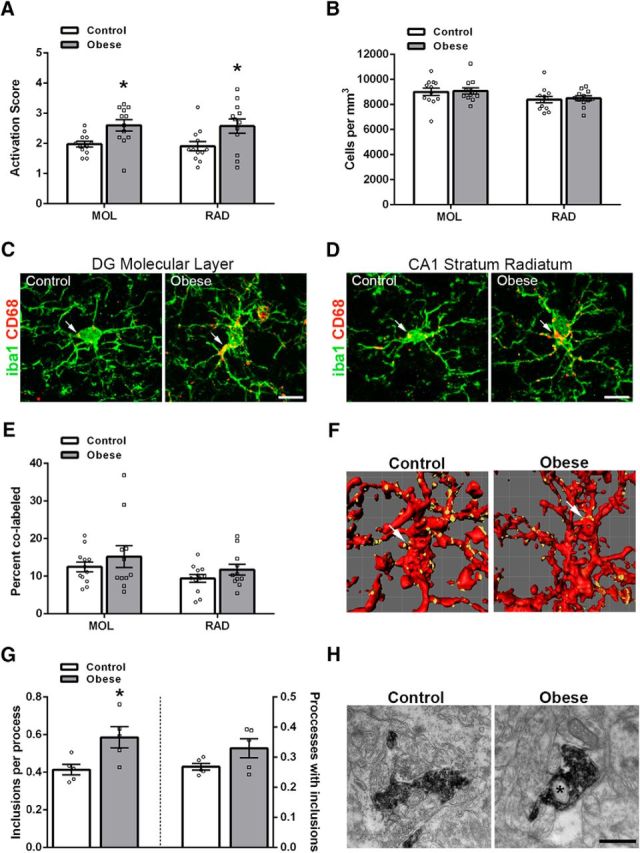
Obesity is associated with increased microglial activation and increased synaptic inclusions in microglial processes. A, Microglial activation scores in the MOL of the DG (t(22) = 3.00, p = 0.0066) and RAD of the CA1 region (t(22) = 2.56, p = 0.028) were higher in obese mice compared with controls. N = 12 for each group (10 cells were averaged per animal). B, The number of iba1-positive microglia in the MOL (t(22) = 0.18, p = 0.86) and RAD (t(22) = 0.34, p = 0.74) did not differ. N = 12 for each group. MOL (C) and RAD (D) immunolabeled with iba1 (green) and CD68 (red). Scale bar, 10 μm. Arrows indicate CD68 and iba1 colabeling. E, The percentage of colabeling of the presynaptic marker synaptophysin with CD11b-positive microglia in the MOL (t(21) = 0.87, p = 0.39) and RAD (t(21) = 1.32, p = 0.20) was not different between groups. N = 12 for control and n = 11 for obese (10 cells were averaged per animal). F, Surface rendered image of CD11b-positive microglia (red) colabeled with synaptophysin (yellow) from the MOL. Arrows indicate colabeling. G, Left, Ultrastructural analyses of the number of putative synaptic inclusions per iba1-positive process revealed an increase in obese mice compared with controls (t(8) = 2.74, p = 0.026). Right, There was no difference between groups in the number of iba1-positive processes with putative synaptic inclusions (t(8) = 1.74, p = 0.12, log transformation followed by unpaired t test). N = 5 for each group with 54–113 processes averaged for each animal. H, EM of a microglial process immunolabeled with iba1 (electron-dense material) from the MOL. Scale bar, 500 nm. *Membrane-bound inclusion within a microglial process. Error bars indicate SEM. *p < 0.05 (unpaired t test).