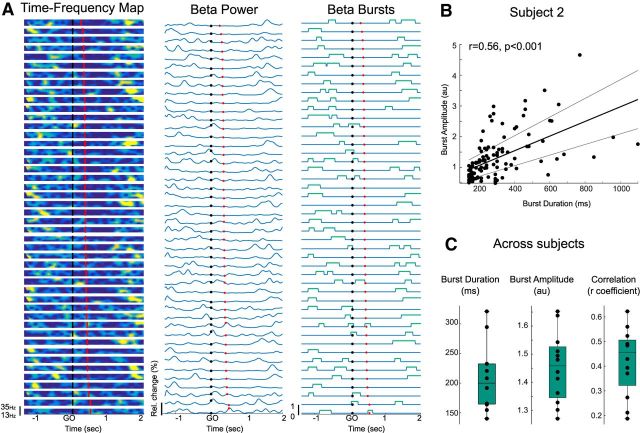
Figure 2.
Definition of beta bursts. A, Single-trial data for 1 subject sorted by RTs. The beta power time courses were computed by averaging over a 6 Hz frequency band centered on the individual beta frequency peak. Then bursts were defined as beta amplitude exceeding the 75th percentile threshold with a minimum duration of 2 cycles. Black dots represent GO cue. Red dots represent movement onset. B, Positive correlation between the burst duration and amplitude in 1 example subject (same as for A; r = 0.56, p < 0.001). C, Mean burst duration and amplitude and positive correlations between the 2 for the 12 subjects. For all plots, only the contralateral STN was considered.

