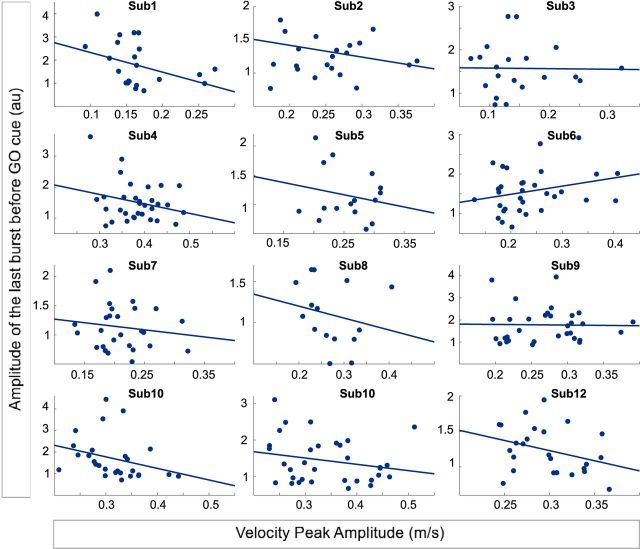
Figure 4.
Single-trial data in individual subjects illustrating the relationship between last burst amplitude and peak velocity. The linear mixed-effects model showed a negative relationship between the amplitude of the last burst before or overlapping the GO cue, and the peak velocity (25 ± 1.8 burst trials per subject; b = −0.013, t(287) = −2.5, p = 0.014). Only the burst trials of the contralateral STN are considered.

