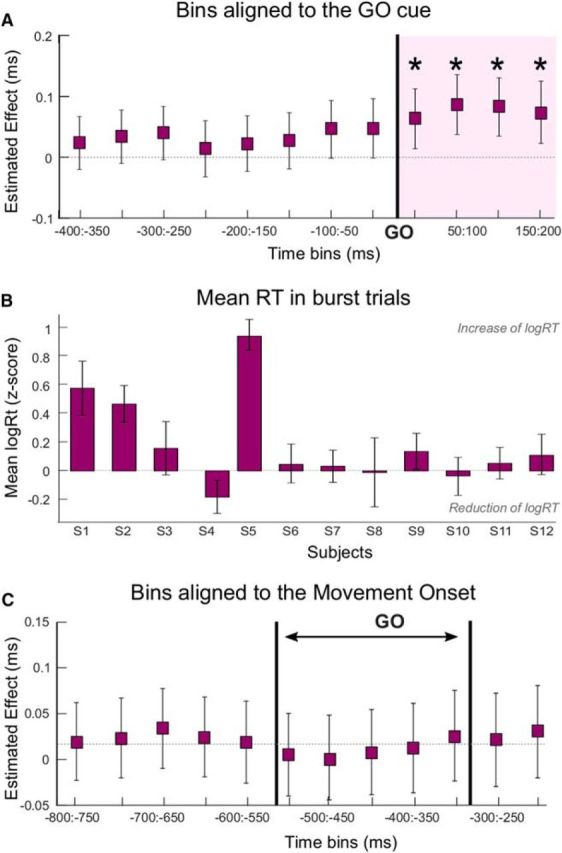
Figure 6.

Bursts after the GO cue increase the RT, with a maximal effect when realigned to GO. A, Estimated effects and 95% CIs derived from the linear mixed-effects model testing the impact of bursts in 50 ms bins on RT. Bins were defined relative to the GO cue, which is indicated by the bold vertical line. B, Mean RTs in burst trials normalized (z score) to the mean RT of all trials for all subjects. A positive value indicates an increase in RT in burst trials. Trials are divided according to the presence of a burst in the 200 ms after GO. C, Estimated effects and 95% CIs derived from the linear mixed-effects model when bins were defined relative to the movement onset. Pair of bold vertical lines indicates the range in which the GO cue would have fallen. For the modeling, the RTs were log transformed. *Significant model (p < 0.05) when bins are considered in isolation. Purple shading represents significant bins after FDR correction.
