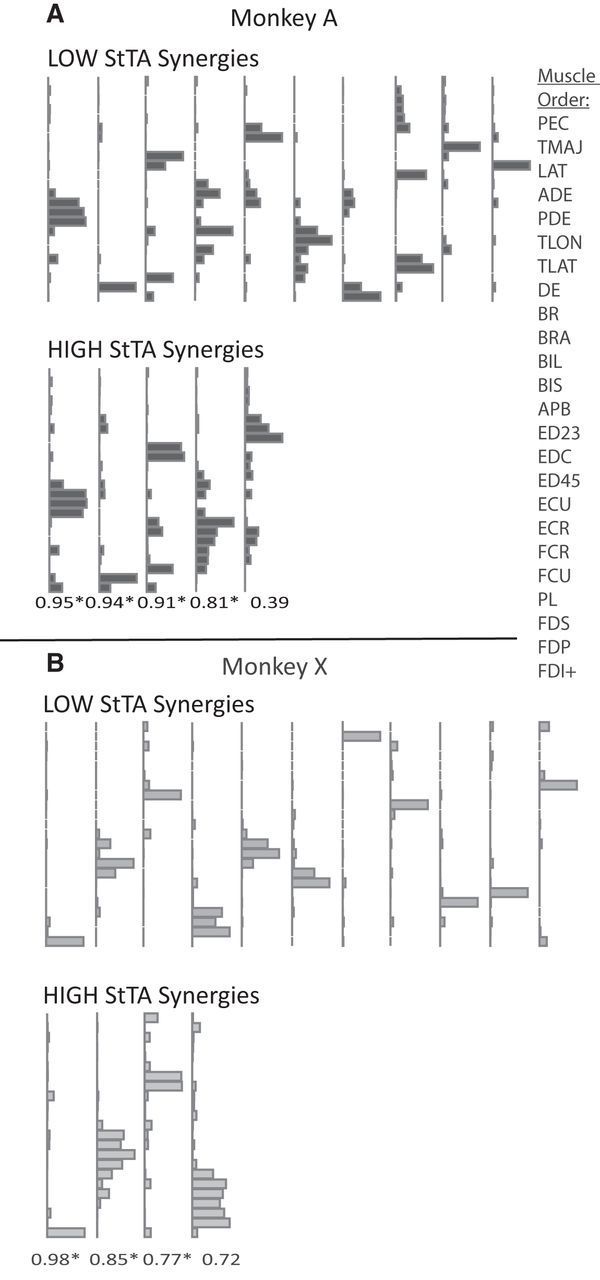
Figure 3.

A, B, Muscle synergies are shown for the two StTA datasets for (A) Monkey A and (B) Monkey X. The LOW StTA was compared with the HIGH StTA synergies with the correlation coefficients (R) written beneath the plots. * denotes p < 0.05. Synergies are arranged in order of the best to worst match. Synergies without a match are presented in random order, as they are given from the NMF algorithm. Each muscle is represented by a single bar in the order listed at the right (the first dorsal interosseous muscle was only present in Monkey A).
