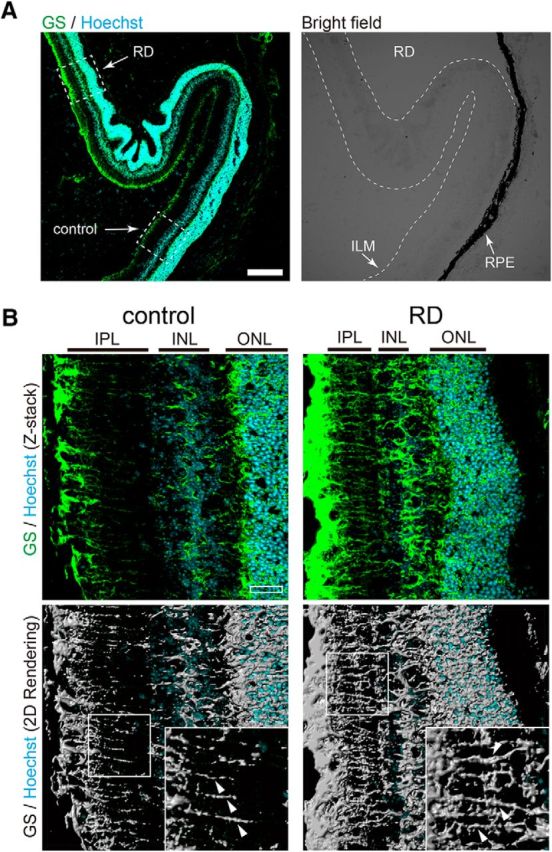
Figure 2.

Müller glial cell swelling in an RD mouse model. A, Immunostaining of glutamine synthetase (GS; a Müller glial cell marker, represented as green) was performed in RD retinae. Nuclei were stained by Hoechst (blue). In the bright-field image, the region of detachment from the RPE is represented as RD, in contrast to the normal region (represented as control). ILM, Inner limiting membrane. Scale bar, 200 μm. B, High magnification of the region highlighted by a dashed box in A. ONL, Outer nuclear layer; INL, inner nuclear layer; IPL, inner plexiform layer. Scale bar, 30 μm. Fluorescent images were converted to binary images by image software. Significant swelling of Müller processes in RD is indicated by arrowheads.
