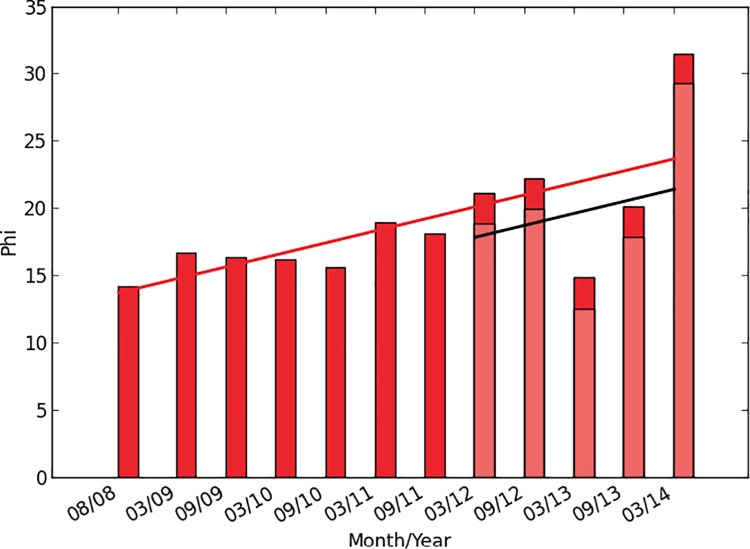
Fig 5. Average phi computed on Internet traffic data over a span of 6 years.
Node sampling = random walk, node sample size = 100, time step size = 100 ms. A change in hardware at the recording site between 2011 and 2012 caused a drop in subsequent recorded traffic [39]. The actual traffic in subsequent years is indicated by a horizontal black line and light red bars. The red bars and the red line show values adjusted to compensate for this change. (See details in Methods).

