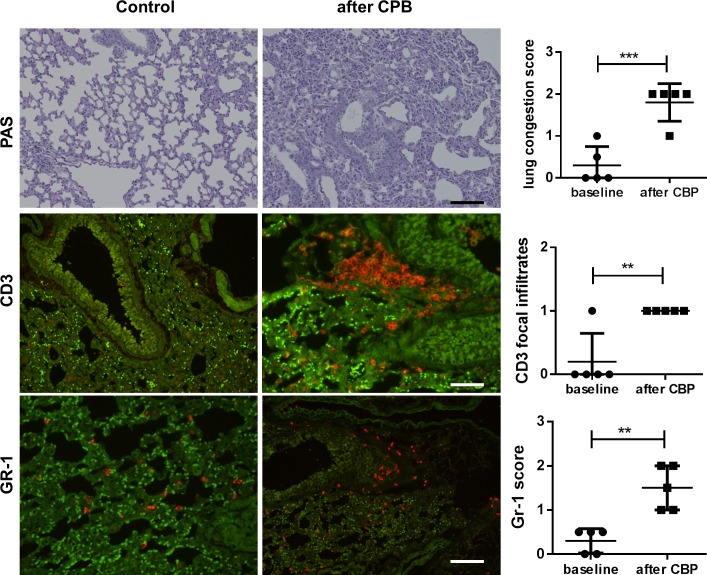
Fig 4. Lung histology and immunofluorescence of infiltrating leukocytes (red) revealed lung injury and inflammatory cell infiltration after CPB.
Representative images of lung tissue from control animals (left row) and animals after CPB/MHCA (right row). (A-B) PAS staining showed pulmonary congestion, atelectasis, and an increase in cellular infiltrates. The scoring system was from 0–3 and revealed moderate congestion in all CPB/MHCA lungs. Immunofluorescence revealed enhanced (C, D) CD3+ T lymphocyte infiltration with focal accumulation after CBP/MHCA and enhanced diffuse (E, F) The presence of CD3 focal infiltrates was scored with 1, the absence with 0. GR-1+ neutrophil infiltration (red) showed that CPB/MHCA caused enhance neutrophile infiltration (scoring from 0–3). The bright green signals represent tracked red blood cells and the darker green areas are due to autofluorescence of lung tissue. Scale bar, 100 μm.

