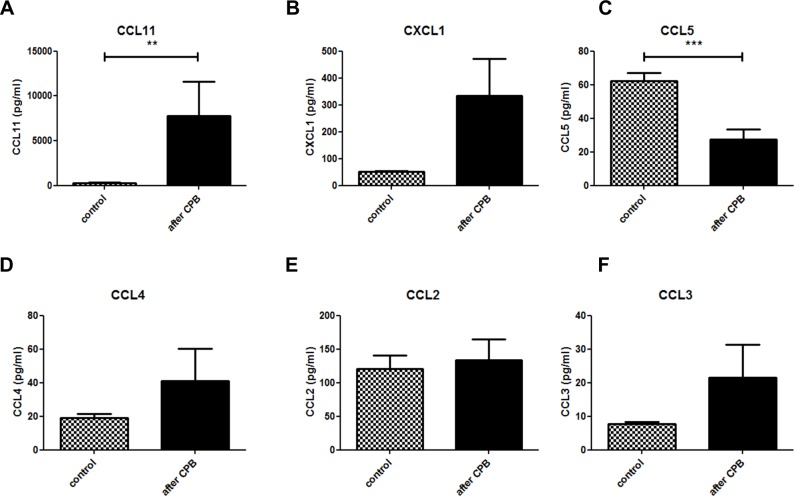
Fig 6. Specific systemic chemokines are induced by CPB.
Expression of CCL11 (A) and CCL5 (C) showed a significant difference between the control and CPB group. CXCL1 (B) showed p = 0.07. There was no statistically significant difference seen for CCL4 (D), CCL2 (E), or CCL3 (F). All values were corrected for hemodilution.

