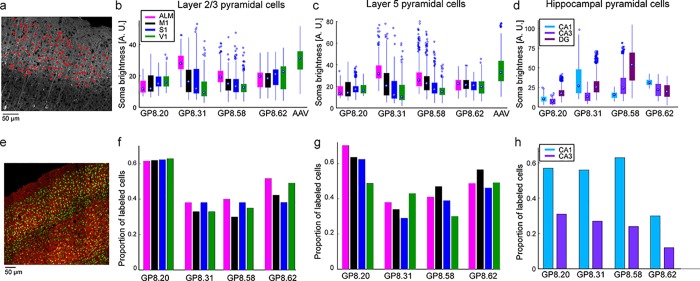
Fig 2. Quantification of jRGECO1a expression.
a. Analysis method used for calculating the brightness of single neurons across brain regions. Confocal microscopy images of fixed brain slices were used for segmentation of cell bodies (red rings, nuclei were excluded). Somatic brightness was calculated by averaging all pixels in each segmented cell. b-d. somatic jRGECO1a brightness of labeled neurons in four GP lines and AAV infected mice. Each box indicates the 25th to 75th percentile distribution. Dots inside the boxes indicate the median, and whisker lengths correspond to the 150% of the 25th to 75th percentile distance, or until it touches the last sample position; outliers are marked by dots beyond the whisker range. Colors correspond to brain regions. b, Layer 2/3 pyramidal cells (sections from 3–7 mice per line; median, 6; 266–841 cells per brain region; median,684). c, Layer 5 pyramidal cells (same number of sections like in b; 255–588 cells per brain region; median, 402). d, Hippocampal pyramidal cells (sections from 4–6 mice per line; median, 5. 80–913 cells per brain region; median, 303). e. Confocal image of GP8.31 fixed tissue (red) counterstained with NeuN (green). f-h. Proportion of neurons that are jRGECO1a-positive, estimated by counterstaining with NeuN, corresponding to b-d, respectively. (sections from 1 mouse per line; 84–298 cells, median, 160). DG labeling density was high but was not quantified (Results). ALM–anterior-lateral area of the motor cortex, M1 –primary motor cortex, S1 –primary somatosensory cortex, V1 –primary visual cortex, DG–dentate gyrus, CA1, CA3 –areas of the hippocampus.

