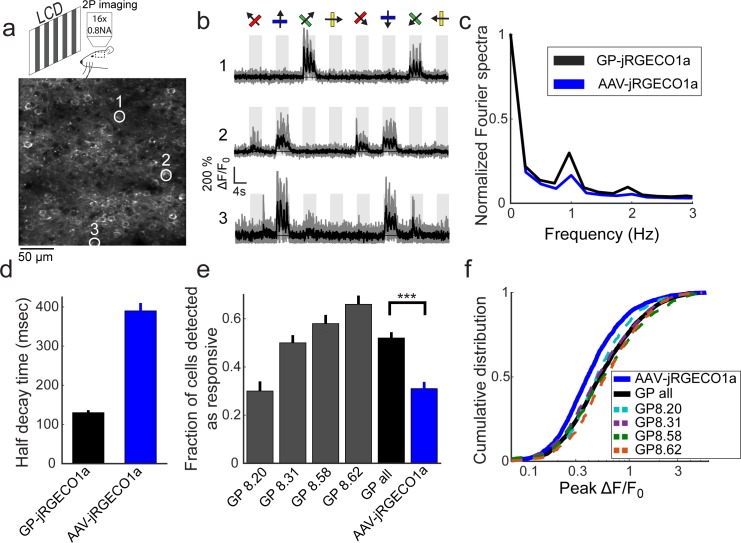
Fig 3. Functional imaging in the primary visual cortex of transgenic mice.
a. Schematic of the experimental setup (top), and an image of GP8.31 layer 2/3 cells in the primary visual cortex (bottom, 120 μm under the dura). b. Responses of three neurons in GP8.31 mice, indicated by circles in a, to drifting grating stimuli. The grating motion directions are indicated by arrows and shown above traces. Single trials (gray) and average of 5 trials (black) are overlaid. The preferred stimulus is the direction evoking the largest response. c. Fourier transform of the response to the preferred stimulus (median across all recorded cells) of GP-jRGECO1a and AAV-jRGECO1a. The 1 Hz peak corresponds to the frequency of the drifting grating (AAV-jRGECO1a, 472 significantly responsive neurons from 4 mice; GP-jRGECO1a, 1650 significantly responsive neurons from 8 mice) d. Half-decay time (mean ± s.e.) after the last response peak during stimulus presentation (GP-jRGECO1a, n = 522 cells from 8 mice; AAV-jRGECO1a, 395 cells from 4 mice). e, Fraction of significant responsive cells (ANOVA test, p<0.01). Gray bars, single GP lines (n = 2 mice per line. GP8.20, 709 neurons in 14 FOVs; GP8.31, 1416, 19; GP8.58, 607, 12; GP8.62, 628, 19); black bar, averaged data from all GP lines; blue bar, AAV-jRGECO1a data (n = 4 mice, 1747 neurons in 40 FOVs). ***, p<0.001 (Wilcoxon Rank Sum Test). f, Distribution of ΔF/F0 response amplitudes to the preferred stimulus. A right-shifted curve indicates higher response amplitudes. Dashed lines, individual GP lines; black line, compiled data from all GP lines; blue line, AAV-jRGECO1a data (same cells as in e). AAV-jRGECO1a data is taken from [4].

