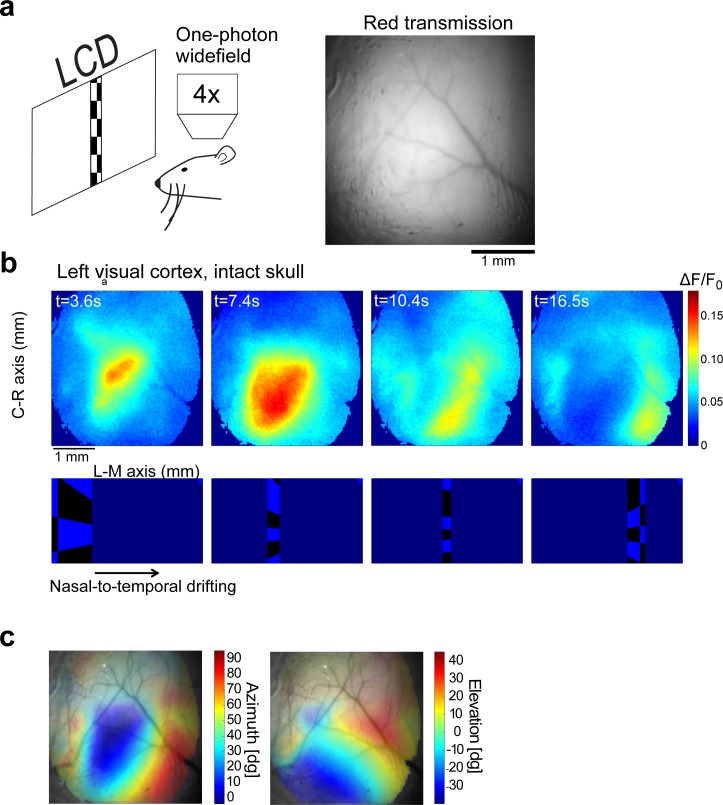
Fig 4. Widefield fluorescence imaging through the intact skull.
a, Schematic of widefield imaging and an image of the brain through the intact skull of a 6-weeks old GP8.20 mouse, taken with a red filter set (585 nm dichroic; 630/75 nm emission bandpass filter). b. A typical time-lapse sequence capturing activity in the visual cortex (top) elicited by a drifting checkerboard stimulus (bottom) (averaged over 20 stimulus repetitions). Note that the cortical activity splits into two gradients, corresponding to the primary visual cortex and the lateral visual cortex (same mouse as in a). c. Retinotopy maps superimposed on the cortical surface acquired by yellow emission filter (550nm dichroic; 575/40nm emission bandpass filter) to enhance the contrast of blood vessels. The degree of transparency was set according to the normalized amplitude of the visual response (stronger response → lower transparency, same mouse as in a).

