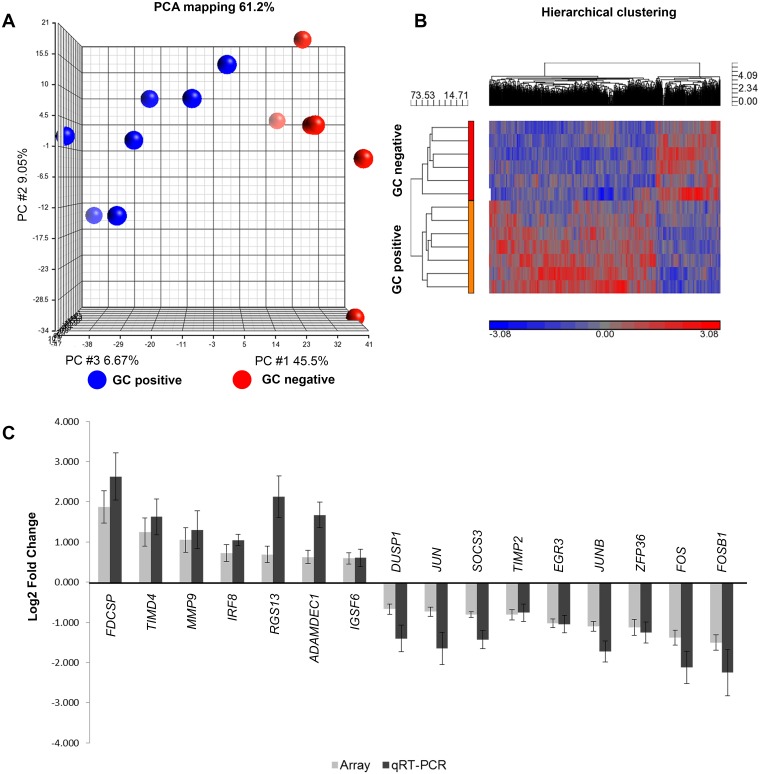
Fig 3. Differential mRNA expression profiles of thymus samples with and without germinal centers.
(A) PCA plot and (B) Hierarchical clustergram plot (ANOVA p<0.05, no fold change). GC positive n = 7; GC negative n = 6. The plots demonstrate clear separation between the groups. (C) qRT-PCR validation of mRNA expression array results. The gray bars represent array data while the black bars represent qRT-PCR data. Log2 fold change has been plotted. Error bars represents +/- SEM. The qRT-PCR results that showed significant differences (as determined by student’s t test, p<0.05) between the GC positive vs GC negative groups have been plotted.

