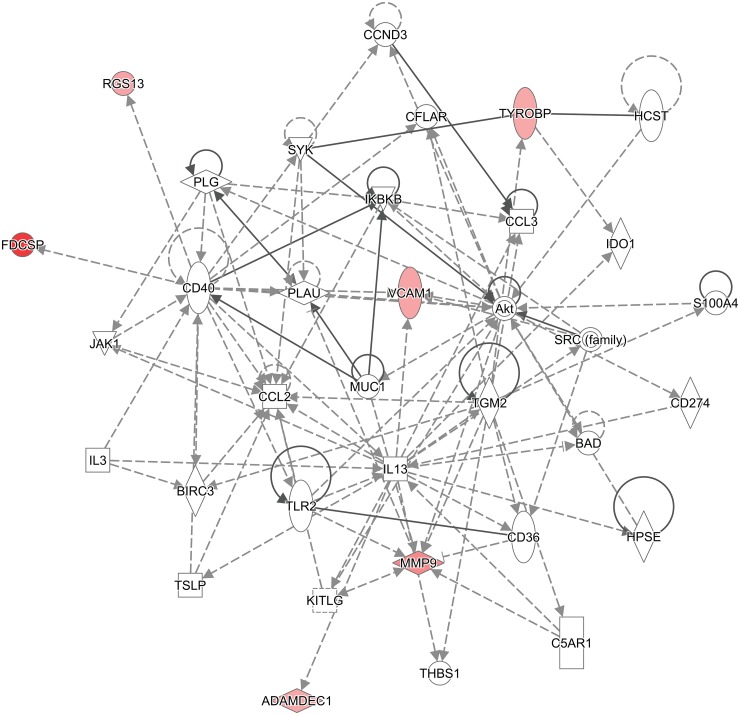
Fig 5. Hematological system development and function, tissue morphology, and inflammatory response network.
Gene associated network function was identified by IPA core analysis. The solid arrows indicate direct interactions and the dotted arrows indicate indirect interaction between the differentially expressed mRNA. The over expressed genes in GC positive samples are marked in red.

