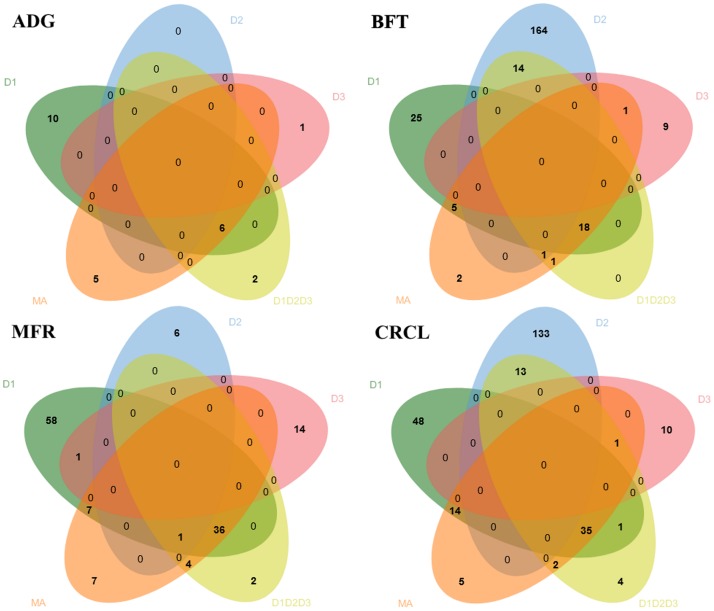
Fig 4. Venn diagram displaying common variants identified for the four traits via the five analyses (i.e. D1, D2, D3, D1D2D3 GWAS and MA).
By using Pearson’s product-moment correlation, the accordance of the p values was estimated by selecting the common set of markers between the output from the association studies conducted for D1, D2, D3, D1D2D3 and the meta-analysis results (S2 Table). The correlation value between JA and MA p values was 0.83 for ADG, 0.81 for BFT, 0.74 for MFR and CRCL (all significant with p < 0.05). The D1 p values were highest correlated with the JA and the MA as compared to the D2 and D3 designs’ p values.

