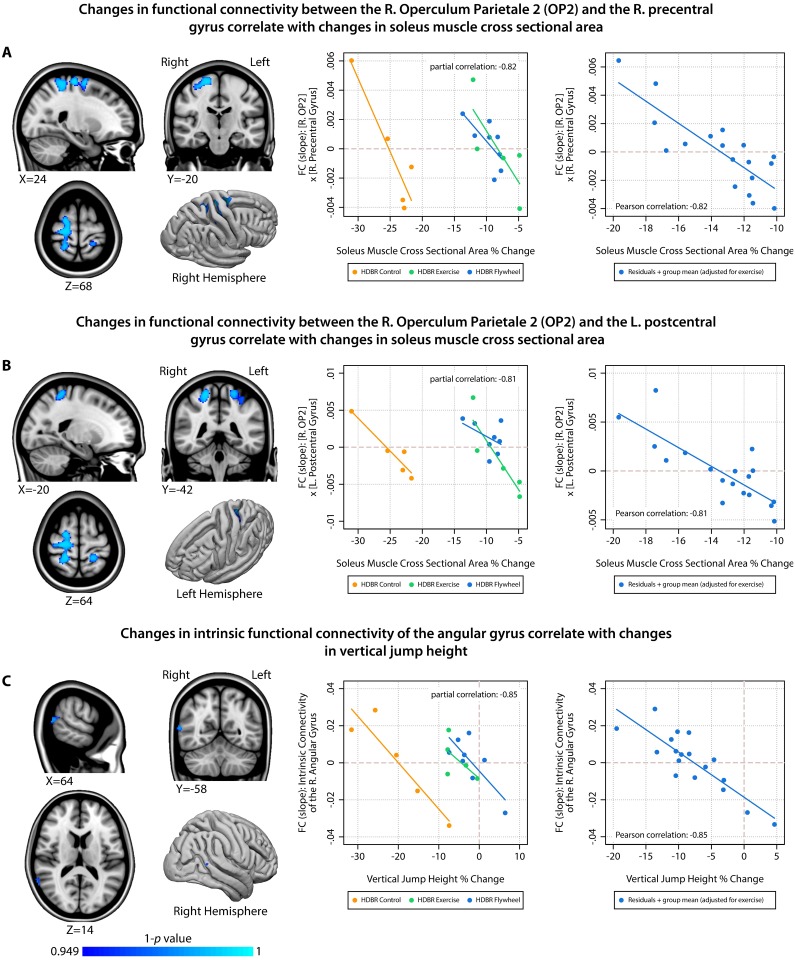
Fig 5. Associations between HDBR-induced changes in brain outcome measures and changes in physical fitness (part 2).
Left column = overview of locations showing significant associations between changes in physical fitness and changes in brain measures; Middle column = scatterplot with fit lines showing correlations at the peak voxel stratified by HDBR group; Right column = scatterplot with fit line showing correlations at the peak voxel adjusted for exercise; R. = Right; FC = Functional Connectivity; L. = Left.

