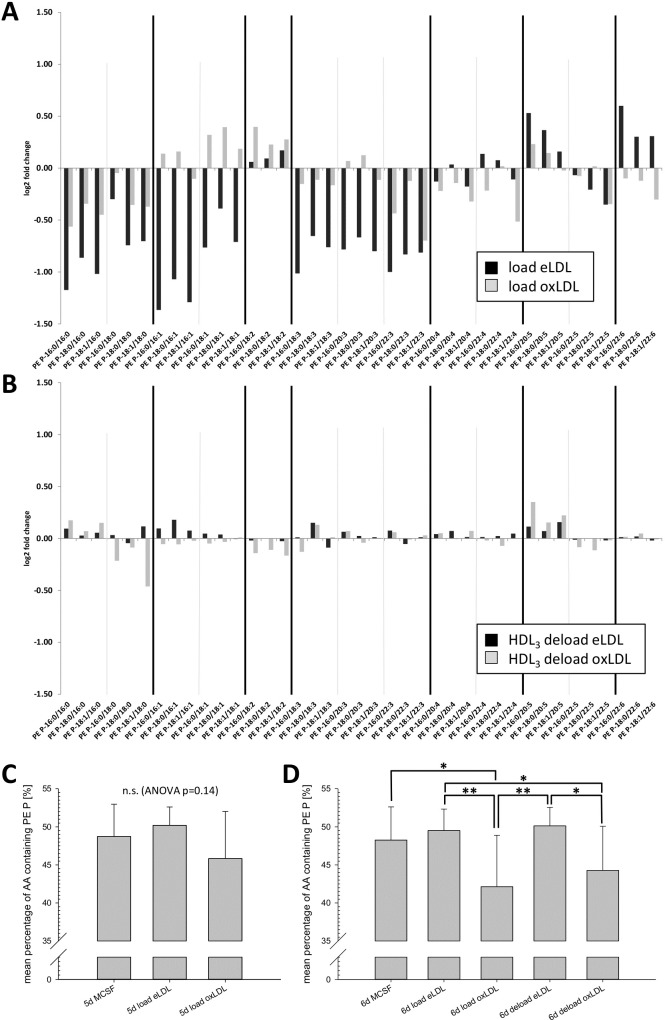
Fig 3. Individual PE plasmalogen species.
(A) Relative changes (log2 fold change) of individual plasmalogen species on day five after 24h loading with either eLDL (black bars) or oxLDL (grey bars) in comparison to controls. (B) Relative changes in cells deloaded with HDL3 for 24h following eLDL or oxLDL treatment in comparison to loaded controls. (C) Percentage of arachidonic acid (20:4) containing PE Ps relative to total PE Ps 24h after lipoprotein loading. (D) Percentage of arachidonic acid containing plasmalogens 48h after lipoprotein loading and following 24h HDL3-mediated deloading in respective cells. n = 9 for all experiments except n = 8 for 6d MCSF control data. C and D: mean percentages +/- SD; (* p<0.05, ** p<0.01).

