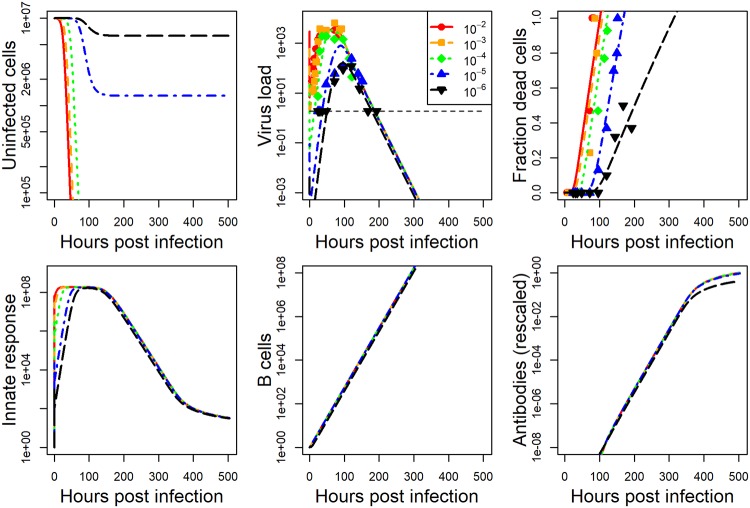
Fig 1. Fit of model to IAV infection data at five different inoculum doses.
Kinetics for 6 of the seven model compartments for the best fit model are plotted. Since infected cells kinetics very closely follows virus kinetics, we did not plot it. Dashed horizontal line indicates the limit of detection for virus load. Best fit parameter values are provided in S1 Text. Data was available for virus load and cell damage. Virus load data was reported as hemagglutination units and cell damage was reported as percent lung cells that are pathological. Model virus load is in the same units as the experimental data. All other model quantities are in units of numbers. Damage in the model is measured as number of dead cells. Both dead cells and antibodies are rescaled as described in the method section to allow comparison between model and data. The plot shows the rescaled quantities.

