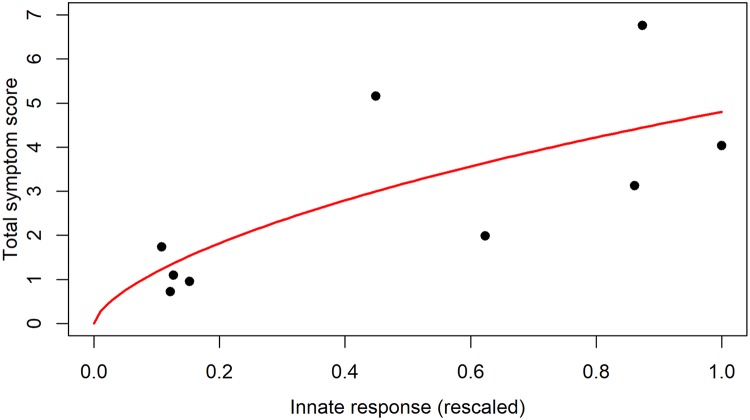
Fig 4. Data and best fit model for the connection between immune response and symptoms.
The innate response is the scaled sum of IFN-a, IL6, IL8, and TNF-a, symptoms are the total symptom score, both quantities are from [28]. The line shows the best fit provided by the equation mapping innate response to symptoms/morbidity.

