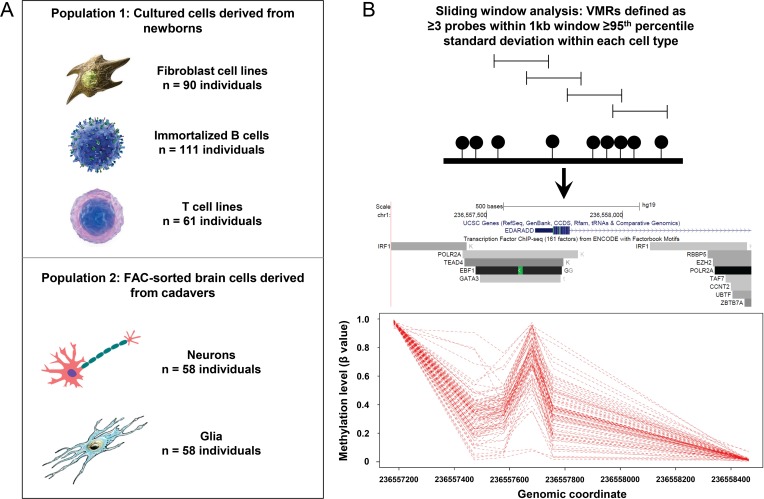
Fig 1.
(A) We studied population variability of DNA methylation in five different purified cell types derived from blood, skin and brain. (B) Utilizing a 1kb sliding window we identified Variably Methylated Regions (VMRs), representing clusters of ≥3 probes within the top 5% of population variability within each cell type. (C) An example VMR identified at the promoter region of EDARADD in fibroblasts. As indicated by the accompanying UCSC Genome Browser tracks, ENCODE data identifies this locus as being bound by several different TFs. Dashed red lines represent DNA methylation profiles for each of the 90 cell lines from the GenCord population, showing extreme epigenetic variability at this locus in the normal population.

