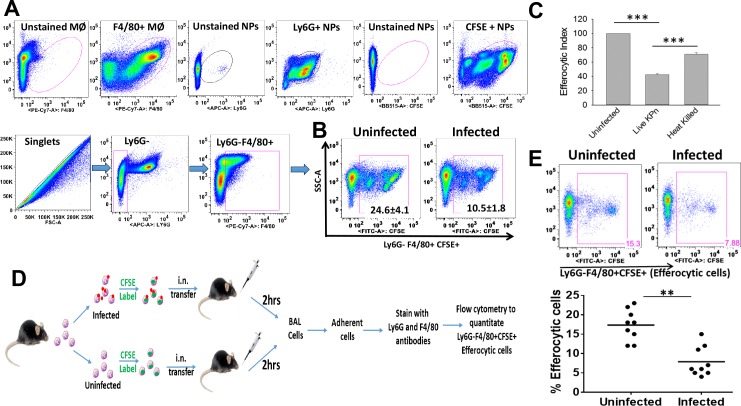
Fig 1. Live KPn infection impairs efferocytosis of neutrophils.
(A) Schematic for gating F4/80+ macrophages that have internalized (hence are Ly6G-) CFSE labelled neutrophils (thus become CFSE+). Upper panel shows unstained and single stained cells. NP; Neutrophils, MØ, Macrophages. (B) Neutrophils left uninfected or infected with live or heat-killed KPn at MOI 10 for 3 hours, followed by labelling with the DNA dye CFSE and incubated with macrophages at 5:1 ratio for 2hrs. Macrophages were then processed for flow-cytometry by staining with anti-F4/80 and anti- Ly6G antibodies. Representative plot from one out of five independent experiments is shown. The numbers on pseudocolor plots show percent (average ± SEM) of Ly6G-F4/80+CFSE+ cells calculated from 5 independent experiments (3 technical replicates for each samples per experiment). The statistical analysis was done by Student’s t test (p<0.001). (C) Efferocytic Index shown as percent efferocytosis of infected neutrophils normalized to that of uninfected cells taken as 100%. Data shown is average ± SEM from 3–5 independent experiments. Statistics was done by ANOVA with Dunn’s post hoc analysis (***, p<0.001). (D). Schematic for in-vivo efferocytosis in the lungs of mice. CFSE labelled uninfected or KPn infected neutrophils were instilled intranasally in anaesthetized mice and lungs were lavaged 2 hrs later. Adherent cells were stained with F4/80 and Ly6G antibodies for flow cytometry. (E). Representative flow cytometry dot plots showing percent of Ly6G-F4/80+CFSE+ efferocytic macrophages from mice instilled with uninfected or KPn infected neutrophils. The scatter plot shows percent efferocytic cells in each group of mice where each dot represents an animal. n = 9 from 3 independent experiments (**, p<0.005).

