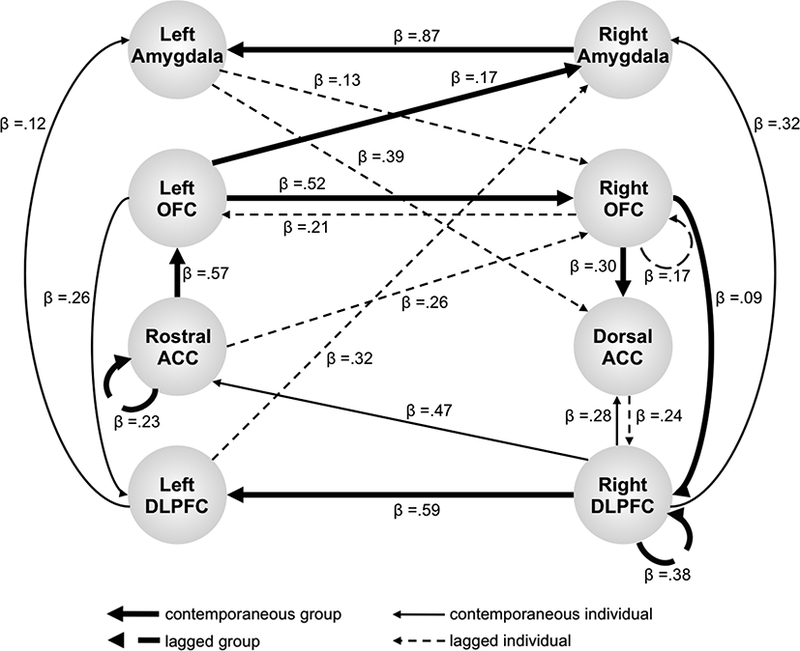
Figure 1.

GIMME neural network for a single participant completing a go/no-go task in which images of alcoholic beverages were the response cues (Beltz, Gates, et al., 2013). Data are from the first wave (i.e., summer before college) of a longitudinal fMRI study of neural responses to alcohol during the college transition, and the network fit these data well according to alternative fit indices (CFI = 1.00, NNFI = 1.00, RMSEA = .000, SRMR = .050). Thick lines are group-level edges estimated for all participants (in the first wave of the study), thin lines are individual-level edges estimated for this participant, solid lines are contemporaneous edges, dashed lines are lagged edges, and edge magnitude is shown by β weights. See text for description of fit indices. OFC: orbitofrontal cortex; ACC: anterior cingulate cortex; DLPFC: dorsolateral prefrontal cortex. (Reproduced with permission from Elsevier from Beltz, Gates, et al., 2013.)
