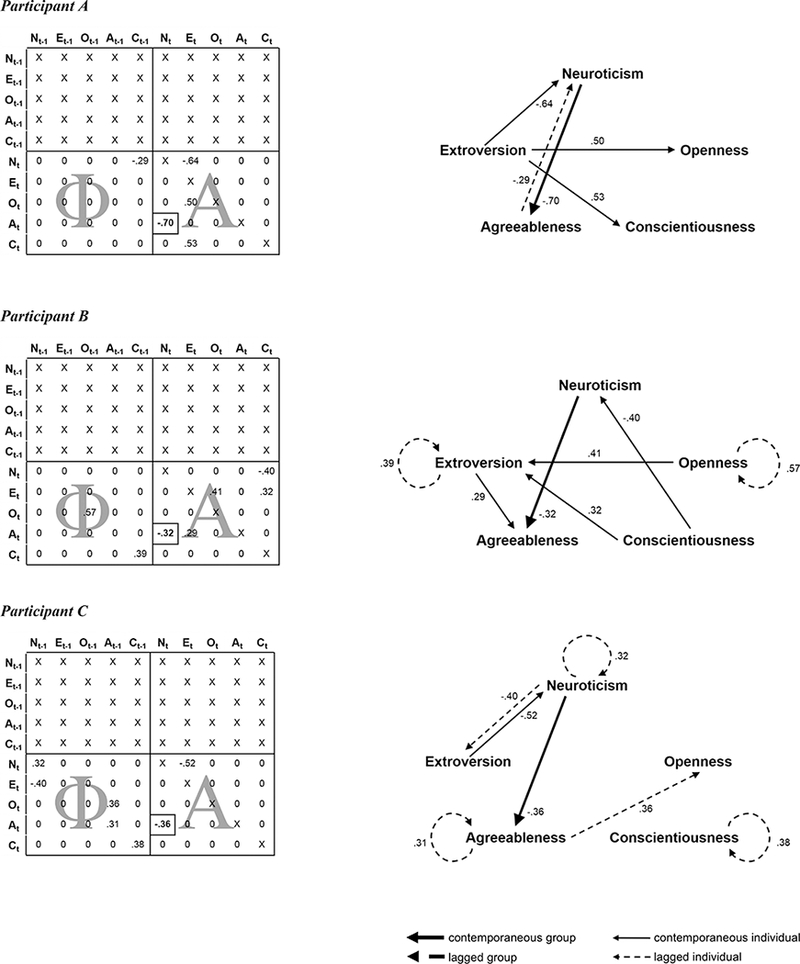
Figure 4.

GIMME behavioral network results for three exemplar participants illustrating the GIMME workflow; these are the same participants whose time series are plotted in Figure 3. On the left are output matrices for each participant, modified for illustration purposes. Beta weights show the direction and magnitude of estimated connections, 0’s indicate connections that could have been estimated but were not (e.g., because they did not significantly improve model fit), X’s indicate parameters that were fixed at 0, and thus, could not have been estimated, and the boxed estimate indicates the single group-level connection. The matrices are read with the nodes in the rows being explained at time t by either lagged (t – 1 edges in the Φ matrix) or contemporaneous (t edges in the A matrix) connections with the nodes in the columns. On the right are the network depictions of the results. Contemporaneous connections are shown by directed solid arrows, lagged connections are shown by directed dashed arrows, the single group-level connection is shown by a thick line, and the individual-level connections are shown by thin lines. Beta weights are shown for all connections. N: neuroticism; E: extroversion; O: openness; A: agreeableness; C: conscientiousness.
