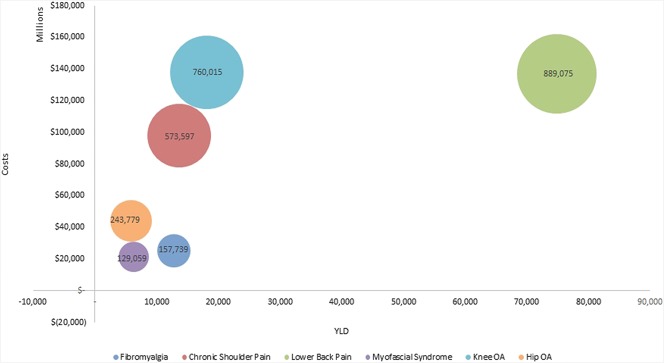
Figure 2.
Schematic representation of costs and consequences of chronic pain. The figure represents the structure of this cost–consequence study. It identifies the cost components as well as the health and nonhealth consequences of chronic pain because of MSK disorders. MSK, musculoskeletal; OA, osteoarthritis; YLD, year lived with disability.

