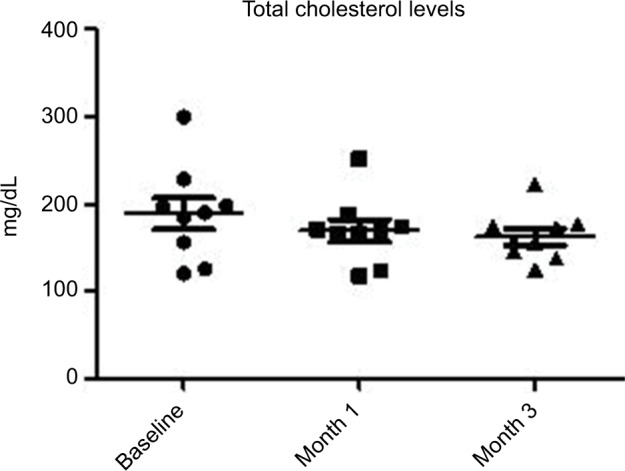
Figure 2.

Evolution of total cholesterol serum levels at baseline and during FOS/GOS dietary supplementation from baseline and after 1 and 3 months (P=0.018; ANOVA).
Abbreviations: ANOVA, analysis of variance FOS/GOS, fructo-oligosaccharides/galacto-oligosaccharides.
