
Figure 6.
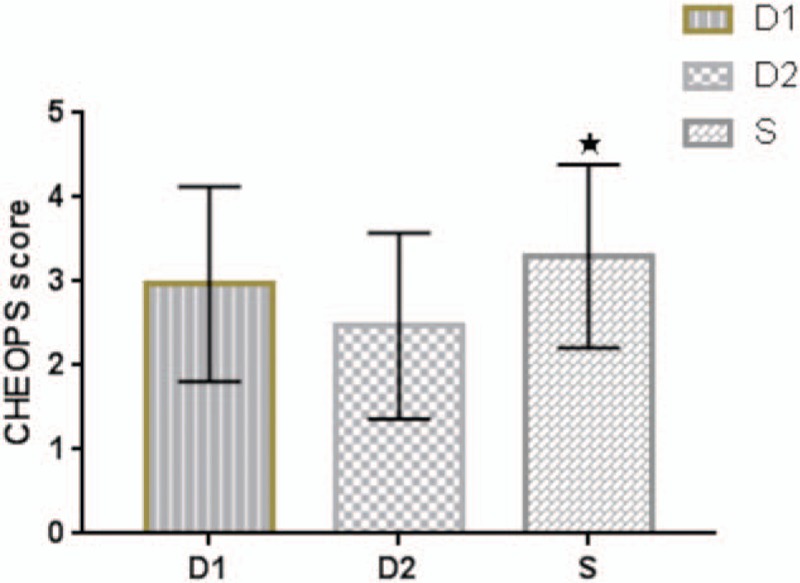
(CHEOPS) score in three groups. Values are expressed as mean ± SD. “★” indicates P < .05 between group D2 and group S. CHEOPS = Children's Hospital of Eastern Ontario Pain Scale, SD = standard deviation.
Official websites use .gov
A
.gov website belongs to an official
government organization in the United States.
Secure .gov websites use HTTPS
A lock (
) or https:// means you've safely
connected to the .gov website. Share sensitive
information only on official, secure websites.
(CHEOPS) score in three groups. Values are expressed as mean ± SD. “★” indicates P < .05 between group D2 and group S. CHEOPS = Children's Hospital of Eastern Ontario Pain Scale, SD = standard deviation.