Figure 1. dMSN self-stimulation elicits rapid and persistent NMDAR-independent reinforcement.
(a) Schematic of a sagittal brain section showing optogenetic stimulation of striatal dMSNs (left), and slice showing fluorescent dMSNs after striatal infusion of a Cre-dependent virus encoding eYFP in a D1-Cre mouse (right). (b) Schematic of the behavioral apparatus showing active (laser-paired) and inactive nosepokes. (c) Example cumulative plot of active nosepokes from a D1-ChR2 (blue) and D1-eYFP (black) mouse. (d) Average nosepokes during a single self-stimulation session for D1-ChR2 and D1-eYFP mice (n = 11 and 8, two-way ANOVA, interaction poke x group, F(1,17)=31.03, p<0.001, posthoc Sidak’s multiple comparisons test, ChR2 active vs eYFP active p<0.001, ChR2 active vs inactive p<0.001, eYFP active vs inactive p=0.921). (e) Average nosepokes during four consecutive daily sessions (n = 8, one-way ANOVA, F(1.908,13.36) = 1.237, p=0.319). (f) Distribution of (left) and average (right) inter-poke intervals for days 1 and 4 of dMSN self-stimulation (n = 8, paired t-test, p=0.0575). (g) Average nosepokes during an extinction session for D1-ChR2 and D1-eYFP mice (n = 8 and 8, two-way ANOVA, interaction poke x group, F(1,14)=47.86, p<0.0001, posthoc Sidak’s multiple comparisons test, ChR2 active vs eYFP active p<0.0001, ChR2 active vs inactive p<0.0001, eYFP active vs inactive p=0.5703). (h) Example cumulative plot of active nosepokes from D1-ChR2 mice expressing (D1-Cre, blue) or lacking (D1-Cre x NR1f/f, red) NMDA receptors in dMSNs. (i) Average nosepokes during a single self-stimulation session for D1-ChR2 mice with (‘D1’) or without (‘D1-NR1KO’) NMDA receptors in dMSNs (n = 9 and 7, two-way ANOVA, interaction poke x group, F(1,14)=0.638, p=0.438, posthoc Sidak’s multiple comparisons test, D1 active vs D1-NR1 active p=0.418). (j) Average distance travelled by D1-ChR2 mice with (‘D1’) or without (‘KO’) NMDA receptors in dMSNs (Mann Whitney U test, p=0.023).

Figure 1—figure supplement 1. Fiber placement and infusion sites.

Figure 1—figure supplement 2. Characterization of dMSN self-stimulation.

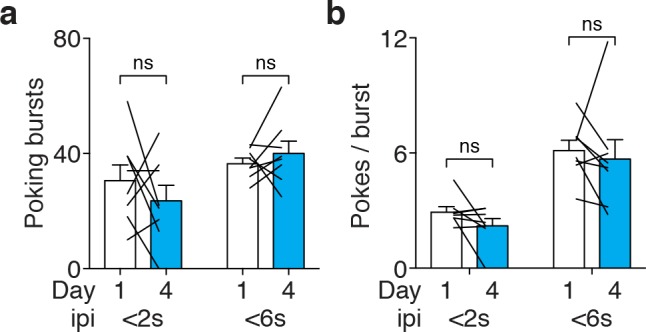
Figure 1—figure supplement 3. dMSN self-stimulation pattern is stable over days.