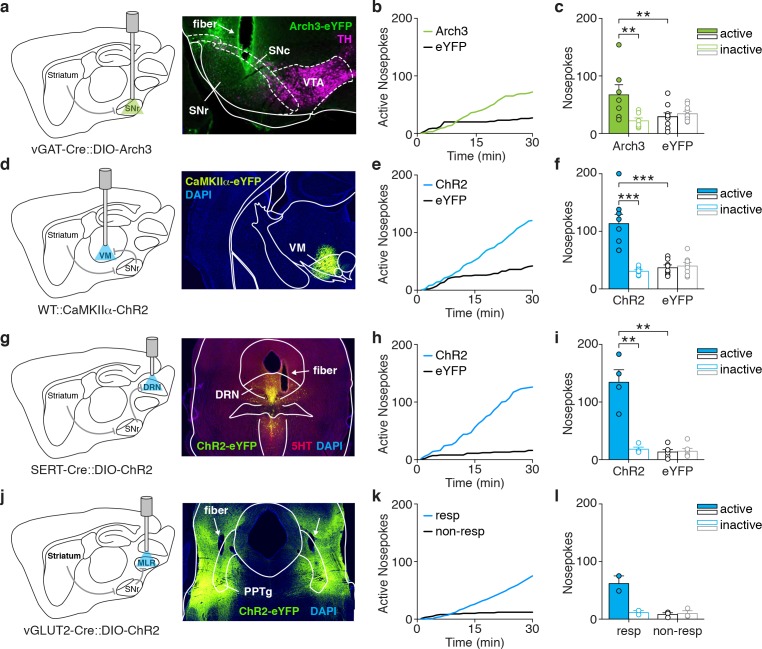
Figure 3. Optogenetic control of basal ganglia output neurons or their projection targets is reinforcing.
(a) Schematic of a sagittal brain section showing optogenetic inhibition of SNr (left), and coronal slice showing Arch3-eYFP and TH expression after SNr infusion of a Cre-dependent construct in a vGAT-Cre mouse and fiber track (right). (b) Example cumulative plot of active nosepokes from a SNr-Arch3 (green) and SNr-eYFP (black) mouse. (c) Average nosepokes during a single self-inhibition session for SNr-Arch3 and SNr-eYFP mice (n = 7 and 10, two-way ANOVA, interaction poke x group, F(1,15)=13.01, p=0.003, posthoc Sidak’s multiple comparisons test, Arch3 active vs eYFP active p=0.007). (d) Schematic of a sagittal brain section showing optogenetic excitation of VM (left), and coronal slice showing ChR2-eYFP expression after VM infusion of CaMKIIα-ChR2 in a WT mouse (right). (e) Example cumulative plot of active nosepokes from a VM-ChR2 (blue) and VM-eYFP (black) mouse. (f) Average nosepokes during a single self-stimulation session for VM-ChR2 and VM-eYFP mice (n = 8 and 8, two-way ANOVA, interaction poke x group, F(1,14)=22.17, p=0.003, posthoc Sidak’s multiple comparisons test, ChR2 active vs eYFP active p<0.001). (g) Schematic of a sagittal brain section showing optogenetic excitation of DRN (left), and coronal slice showing ChR2-eYFP overlapping with 5HT expression after infusion of DIO-ChR2 in a SERT-Cre mouse and fiber track (right). (h) Example cumulative plot of active nosepokes from a DRN-ChR2 (blue) and DRN-eYFP (black) mouse. (i) Average nosepokes during a single self-stimulation session for DRN-ChR2 and DRN-eYFP mice (n = 4 and 6, two-way ANOVA, interaction poke x group, F(1,8)=38.09, p<0.001, posthoc Sidak’s multiple comparisons test, ChR2 active vs eYFP active p<0.001). (j) Schematic of a sagittal brain section showing optogenetic excitation of the MLR (left), and coronal slice showing ChR2-eYFP expression after MLR infusion (centered around the PPTg) of DIO-ChR2 in a vGLUT2-Cre mouse and fiber tracks (right). (k) Example cumulative plot of active nosepokes from an MLR-ChR2 responsive (resp, blue) and MLR-ChR2 non-responsive (non-resp, black) mouse. (l) Average nosepokes during a single self-stimulation session for MLR-ChR2 responsive and non-responsive mice (n = 2 and 3). Abbreviations: 5HT, 5-hydroxytryptamine; DRN, dorsal raphe nucleus; MLR, mesencephalic locomotor region, PPTg, pedunculopontine tegmentum; SNc, substantia nigra compacta; SNr, substantia nigra reticulata; TH, tyrosine hydroxylase; VM, ventromedial thalamus; VTA, ventral tegmental area.

