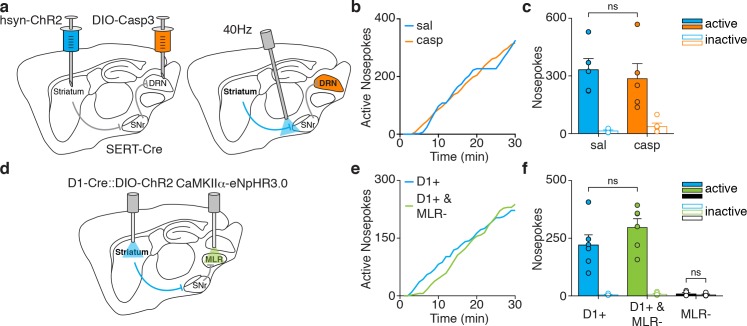
Figure 4. Silencing DRN serotonergic neurons or MLR glutamatergic neurons does not disrupt dMSN self-stimulation.
(a) Sagittal schematic showing injection of a hSyn-ChR2 construct in the striatum and DIO-Casp3 in the DRN of a SERT-Cre mouse, and optic fiber placement above dMSN axons. (b) Example cumulative plot of active nosepokes for dMSN axon stimulation in mice infused with saline (sal, blue) or DIO-Casp3 (casp, orange). (c) Average nosepokes during a single self-stimulation session for dMSN axon self-stimulation in mice with intact (sal) or lesioned (casp) serotonergic neurons in DRN (sal versus casp, two-way ANOVA, interaction pokes x stim F(1,8)=0.45, p=0.521, posthoc Sidak’s multiple comparisons test, sal active vs casp active p=0.76). (d) Sagittal schematic showing optogenetic stimulation of dMSNs and inhibition of MLR glutamatergic neurons (CaMKIIα-eNpHR3.0). (e) Example cumulative plot of active nosepokes from D1-ChR2 mice for dMSN stimulation alone (blue) or paired with MLR inhibition (green). (f) Average nosepokes during a single self-stimulation session for dMSN stimulation alone or paired with MLR inhibition, or MLR inhibition alone (D1 +versus D1+ and MLR-, two-way ANOVA, interaction pokes x stim F(1,10)=1.618, p=0.232, posthoc Sidak’s multiple comparisons test, D1 +active vs D1+ and MLR- active p=0.142; MLR-, Wilcoxon signed rank test, active vs inactive p=0.625).


