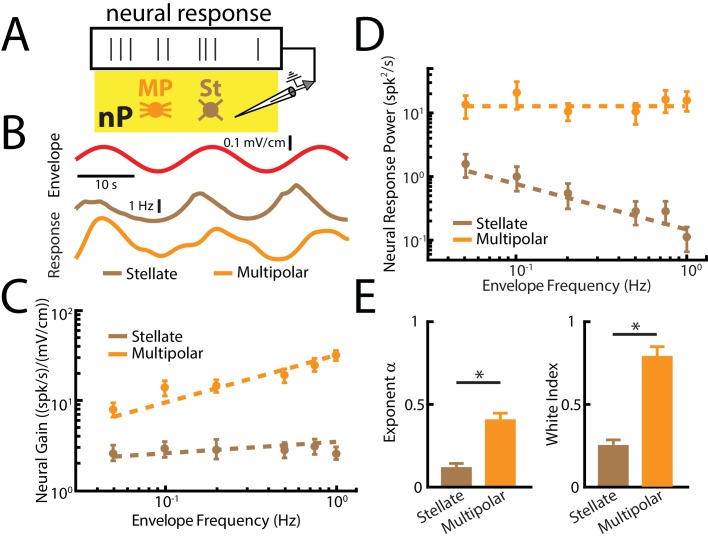
Figure 6. nP neurons projecting indirectly to ELL display tuning properties that are optimized to natural stimulus statistics.
(A) Recordings were obtained from either Stellate (St) or multipolar (MP) cells within nP. (B) Top: sinusoidal envelope waveform (red). Bottom: Time dependent firing from typical nP stellate (brown) and multipolar (orange) cells. (C) Population-averaged tuning curve quantified by neural gain as a function of envelope frequency for nP stellate (brown) and multipolar (orange) cells. The dashed lines show the best power law fits to the data. (D) Population-averaged neural response power for stellate (brown) and multipolar (orange) cells. The dashed lines show the best power law fits to the data. (E) Population-averaged best-fit power law exponents (left) and white index (right) values for stellate (brown) and multipolar (orange) cells. In both cases, values obtained for stellate and multipolar cells were significantly different from one another (exponent: χ2 = 12, p=5.32*10 - 4, Kruskal-Wallis ANOVA; white index: χ2 = 10.7, p=0.0011, Kruskal-Wallis ANOVA). ‘*' indicates statistical significance at the p=0.05 level.
Figure 6—figure supplement 1. Distinguishing between nP stellate and multipolar cells using previously characterized differences in their electrophysiological properties.


